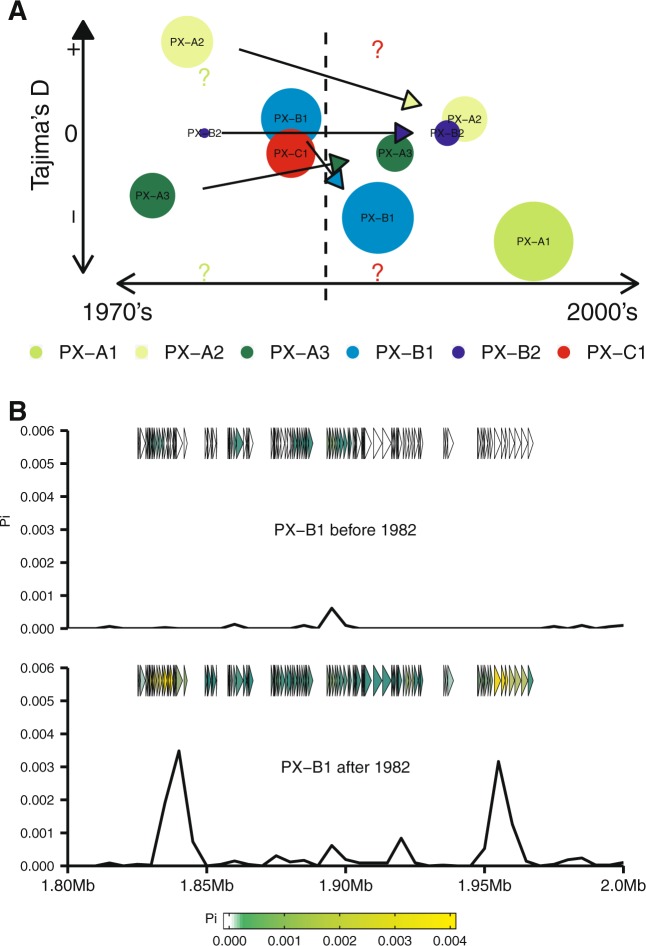
Fig. 5.
Genome-wide variation in Tajima’s D values and nucleotide diversity (pi) in Xanthomonas oryzae pv. oryzae (Xoo) populations in the Philippines during the Green Revolution. a Tajima’s D computations of six populations subdivided into epidemics occurring before and after the mid-1980s. The size of the circles represents the number of representative isolates from each population (Table S4). Solid arrow lines illustrate the direction of known Xoo demographics. Question marks indicate no representative samples from a particular time point. Timeline is represented in the X-axis. Populations PX-A1, PX-A2, PX-A3, PX-B1, PX-B2, and PX-C1 are color-coded. b Dramatic change in nucleotide diversity (pi) within a 140 kb fragment from the PX-B1 population collected before and after the mid-1980s. The Y-axis represents pi values while the X-axis represents the location of each gene (triangle) within the 140 kb fragment. The average values of pi for each gene range from lower diversity (white) to higher diversity (yellow)

