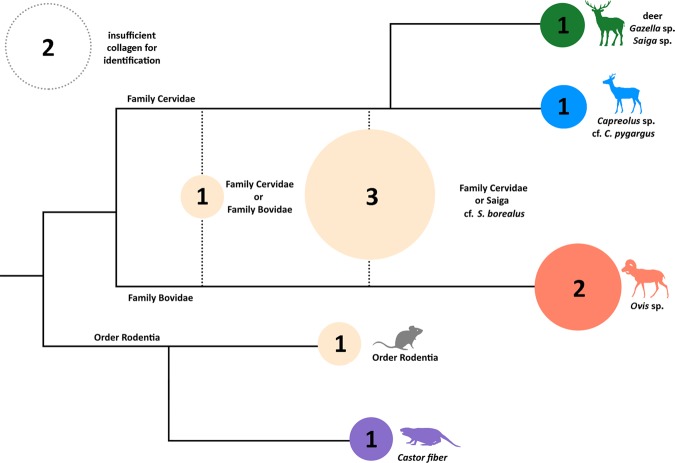
Figure 3.
Zooarchaeology by Mass Spectrometry (ZooMS) taxonomic identifications overlain on a schematic of a cladogram for bone remains from Bagsagiin Bulan. Specimens with conclusive markers are shown in color (blue, red, green, purple), while those with missing markers are shown in tan according to the greatest possible level of taxonomic specificity. Circles have been scaled to size according to quantity of identified specimens in each category and inset numbers refer to the number of specimens identified. Dotted circle in top left shows specimens with insufficient collagen for analysis.

