Supplemental Fig. 2.

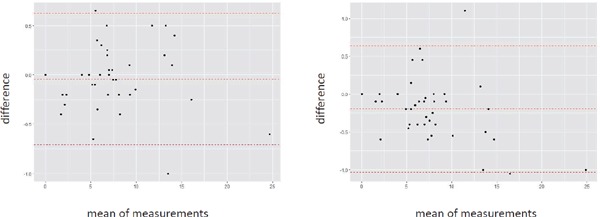
Bland-Altmann plot of cIMT
X-axis represents mean of the difference. Y-axis represents difference. (A) Intraobserver. (B) Interobserver.

Bland-Altmann plot of cIMT
X-axis represents mean of the difference. Y-axis represents difference. (A) Intraobserver. (B) Interobserver.