
Fig. 5.
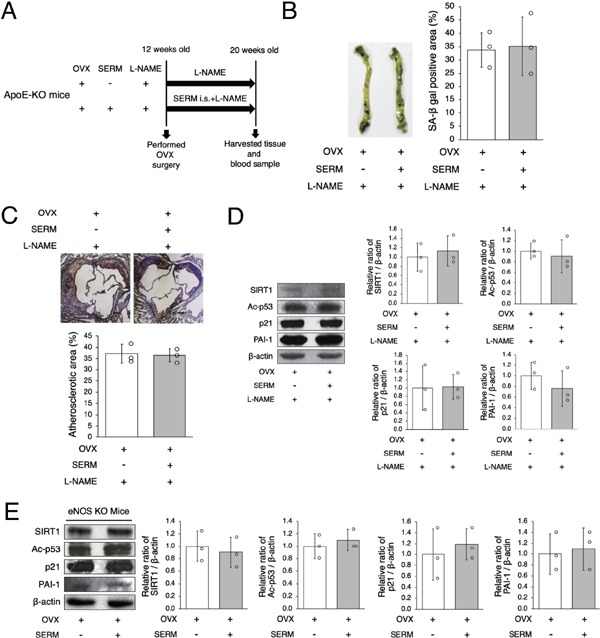
SERM-induced SIRT1 upregulation is regulated by eNOS
A: Animal experiment protocol
B: Representative images of SA-β gal staining of senescent cells (blue) in the aortas of OVX + SERM mice and OVX + SERM + L-NAME mice are shown in the left panel. There were no differences in SA-β gal positive staining in the two groups.
C: Representative images of Oil Red O-stained cross-sections of the aortic root of OVX + SERM mice and OVX + SERM + L-NAME mice are shown in the upper panel. There were no differences in atherosclerotic lesions in the two groups. Scale bar = 200 µm
D: Representative band of western blot analysis and densitometric analysis is shown in the left panel. There were no differences in SIRT1, Ac-p53, p21, and PAI-1 expression in the two groups.
E: BZA, a SERM, was administrated to eNOS-KO OVX mice. Representative band of western blot analysis and densitometric analysis is shown in the left panel. There were no differences in SIRT1, Ac-p53, p21, and PAI-1 expression between control vehicle and SERM mice.
All data are shown as the mean ± S.D.; n = 3 in each group