
Figure 1.
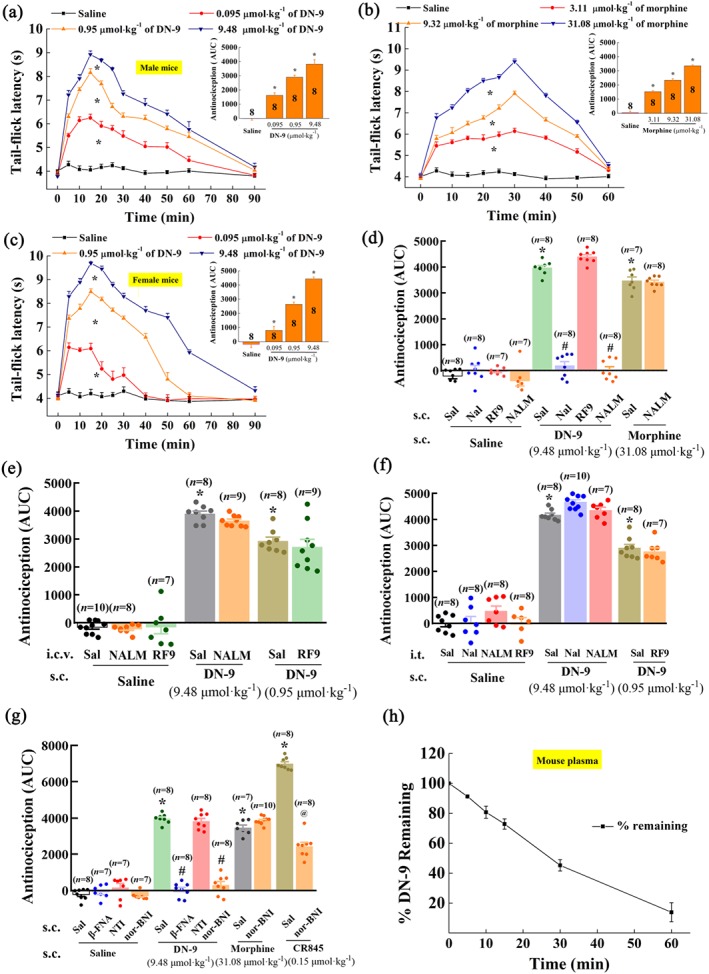
Antinociceptive effects of DN‐9 and morphine in the mouse tail–flick test. Time‐response curves for the antinociception induced by 0.095, 0.95, and 9.48 μmol·kg−1 of DN‐9 (a), 3.11, 9.32, and 31.08 μmol·kg−1 of morphine (b) in male mice, and 0.095, 0.95, and 9.48 μmol·kg−1 of DN‐9 in female mice (c) after s.c. administration. The AUC values of MPE % during the observed period from these data were statistically analysed and are presented in the insert. * P < .05, significantly different from saline group; one‐way ANOVA followed by Dunnett's post hoc test. (d) Effects of peripheral administration of the opioid receptor antagonists naloxone (Nal, 10 mg·kg−1) and naloxone methiodide (NALM, 10 mg·kg−1) and NPFF receptor antagonist RF9 (5 mg·kg−1) on the antinociception induced by DN‐9 and morphine. Effect of i.c.v. (e) and i.t. (f) administration of the opioid receptor antagonists naloxone (5 nmol) and NALM (5 nmol) and NPFF receptor antagonist RF9 (10 nmol) on the antinociception induced by DN‐9. (g) Effects of peripheral administration of the selective opioid receptor antagonists β‐FNA (1 mg·kg−1), NTI (1 mg·kg−1), and nor‐BNI (1 mg·kg−1) on the antinociception induced by DN‐9, morphine, and CR845.Each data point represents the mean ± SEM, n = 7–10 mice per group. * P < .05, significantly different from saline + saline group, # P < .05, significantly different from saline + DN‐9 group, @ P < .05, significantly different from saline + CR845 group; one‐way ANOVA followed by Bonferroni's post hoc test. (h) in vitro plasma stability assessment of DN‐9 in mouse plasma. Each data point represents the mean ± SEM, n = 4 independent experiments. RF9, 1‐adamantanecarbonyl‐RF‐NH2