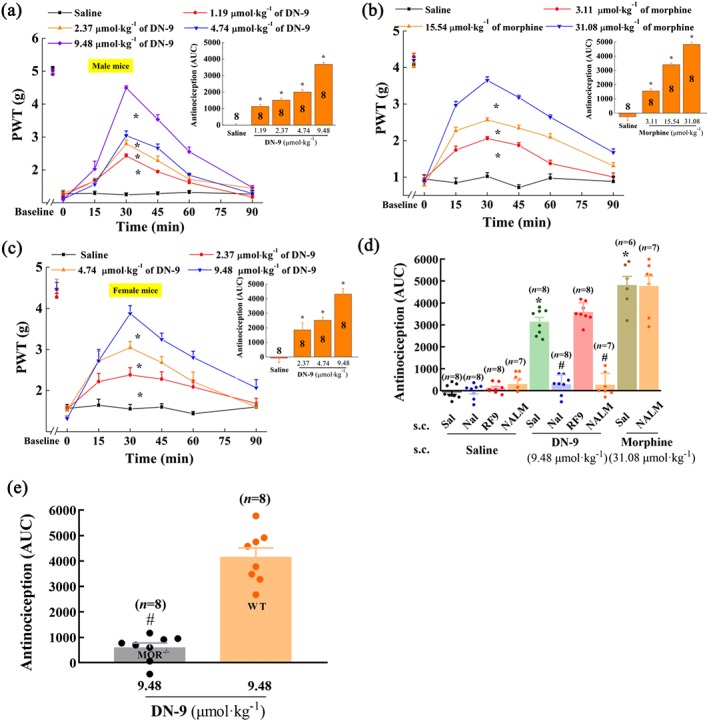
Figure 2.

Effects of s.c. injection of DN‐9 and morphine on carrageenan‐induced inflammatory pain in mice. Time‐response curves for the anti‐allodynic effects induced by 1.19, 2.37, 4.74, and 9.48 μmol·kg−1 of DN‐9 (a), 3.11, 15.54, and 31.08 μmol·kg−1 of morphine (b) in male mice, and 2.37, 4.74, and 9.48 μmol·kg−1 DN‐9 in female mice (c). The AUC values of MPE % during the observed period from these data were statistically analysed and presented in the insert. * P < .05, significantly different from saline group; one‐way ANOVA followed by Dunnett's post hoc test. (d) Effects of peripheral administration of the opioid receptor antagonists naloxone (Nal, 10 mg·kg−1) and naloxone methiodide (NALM, 10 mg·kg−1) and NPFF receptor antagonist RF9 (5 mg·kg−1) on the anti‐allodynic effects of DN‐9 and morphine. * P < .05, significantly different from saline + saline group, # P < .05, significantly different from saline + DN‐9 group; one‐way ANOVA followed by Bonferroni's post hoc test. (e) The different anti‐allodynic effects between WT and MOR−/− mice. # P < .05, significantly different from WT mice; unpaired t test. Each data point represents the mean ± SEM, n = 6–8 mice per group
