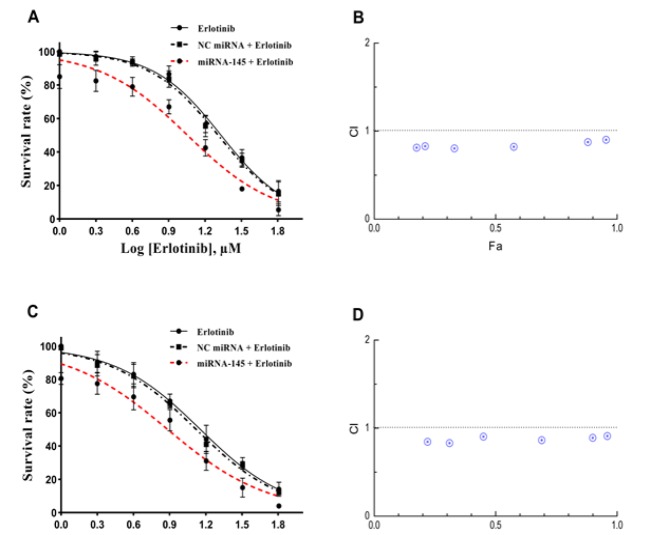
Figure 2.
Effect of miRNA-145 on Sensitivity of the Lung Cancer Cells to Erlotinib. Cells were treated with miRNA-145 (50 nM) and various concentrations of erlotinib for 24 h (A and B) and 48 h (C and D). After treatment, cell survival was determined by the MTT assay as described in the method section. Cell survival curves were plotted using Prism 6.01 software. The data represent mean±SD (n=3). Data from three independent experiments were used to plot the combination index (CI) versus fractional effect (Fa) according the method of Chou and Talalay. Dashed lines indicate CI=1.

