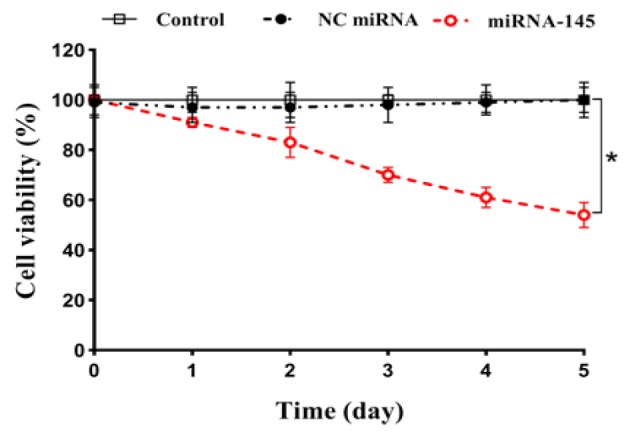
Figure 3.

Growth Curve of A549 Cells Transfected with miRNA-145 and Negative Control (NC) miRNA. Cell growth was measured using trypan blue exclusion assay over a period of 5 days. The results are expressed as mean±SD (n=3). *p<0.05 versus blank control or NC miRNA
