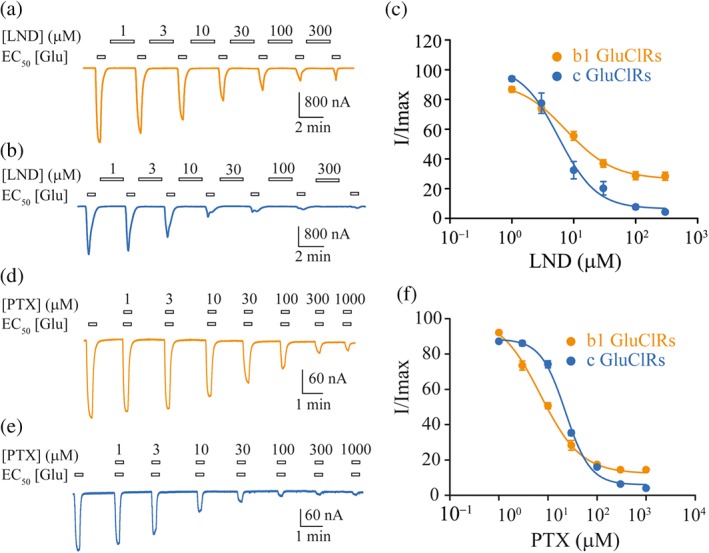
Figure 3.

Glutamate‐gated current inhibition by LND and PTX. (a, b) Example currents gated by an EC50 concentration of glutamate in response to increasing concentrations of LND for b1 GluCl receptors (a) and c GluCl receptors (b). (c) Group concentration–response plots for inhibition by LND, fitted to Hill equations. The IC50s were not significantly different, whereas the inhibition at maximum concentration of LND was significantly different. (d, e) Typical currents gated by an EC50 concentration of glutamate in response to increasing concentrations of PTX for b1 GluCl receptors (d) and c GluCl receptors (e). (f) Group concentration–response plots for inhibition by PTX, fitted to Hill equations. The IC50s were significantly different as was the inhibition at maximum concentration of PTX. The clamped membrane potential was −40 mV. Data points are means ± SEM
