Figure 4.

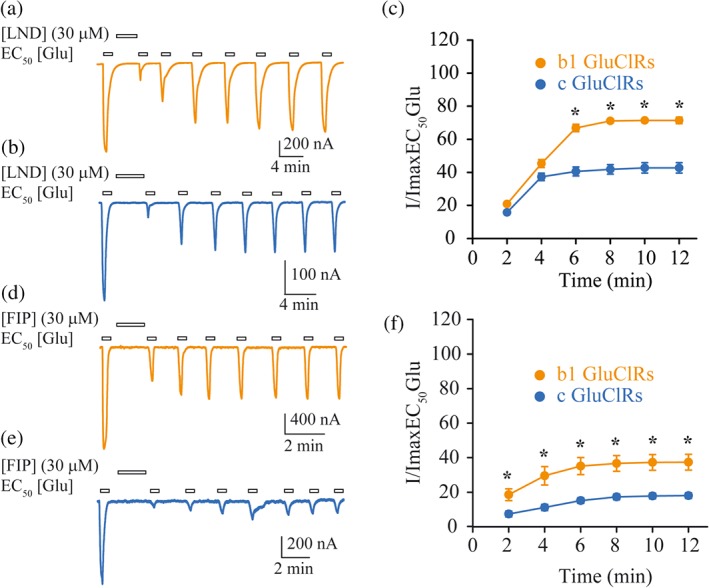
Recovery profile of glutamate‐gated currents from inhibition from LND and FIP. (a, b) Typical currents gated by an EC50 concentration of glutamate in response to a single application of a maximal concentration of LND for b1 GluCl receptors (a) and c GluCl receptors (b). (c) Group plots of time‐dependent current recovery showing that b1 GluCl receptors recover to a significantly greater extent than c GluCl receptors. (d, e) Typical currents gated by an EC50 concentration of glutamate in response to a single application of a maximal concentration of FIP for b1 GluCl receptors (d) and c GluCl receptors (e). (f) Group plots of time‐dependent current recovery showing that b1 GluCl receptors recover to a significantly greater extent, but at a similar rate as c GluCl receptors. The clamped membrane potential was −40 mV. Data points are means ± SEM. *P < .05, significantly different from c GluCl receptors.
