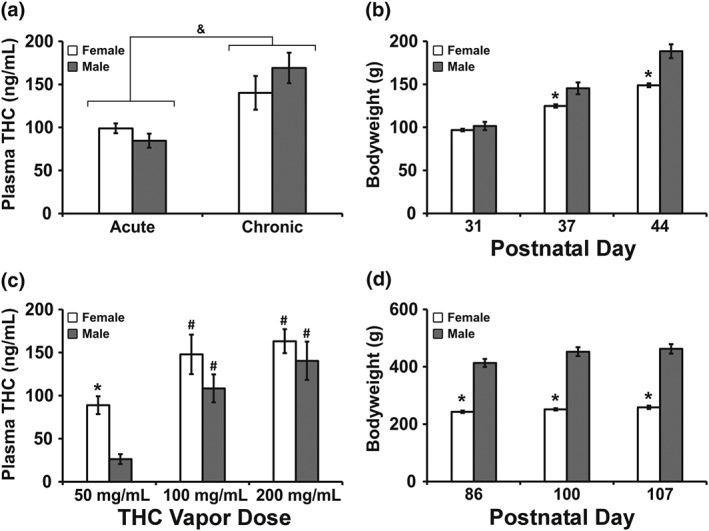
Figure 5.

(a,c) Mean (±SEM) plasma THC levels from female and male rats (N = 8 per group) exposed to (a) THC (100 mg·ml−1) vapour on PND 31 (acute), 36–39 (chronic) or (c) THC (50–200 mg·ml−1) on PND 86, 100, and 107. Corresponding bodyweights are presented for the adolescent (b) and adult (d) age intervals. * P <.05, significant sex difference for a given dose or day;, & P <.05, significant difference from the acute condition across groups; # P <.05, significant difference from the 50 mg·ml−1 condition.
