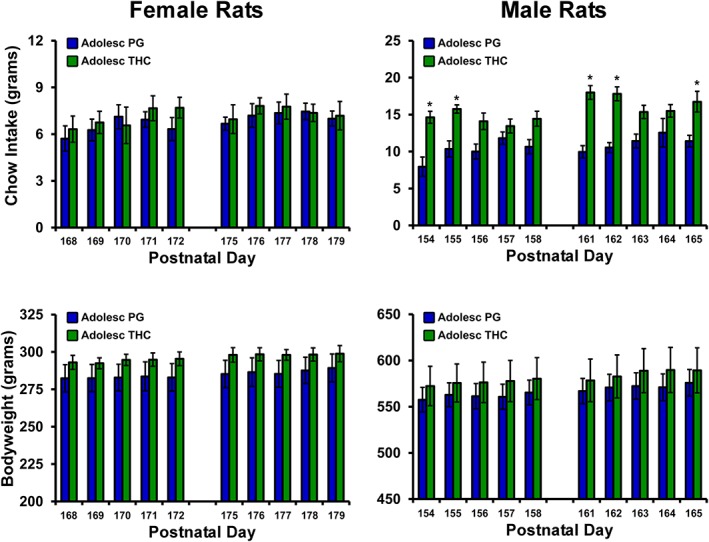
Figure 6.

Mean (±SEM) chow intake and bodyweight of female and male rat cohorts exposed to repeated PG or THC during adolescence (N = 8 per group except N = 7 female/THC) and assessed during adulthood. * P <.05, significant difference between treatment groups, within sex.
