Figure 2.

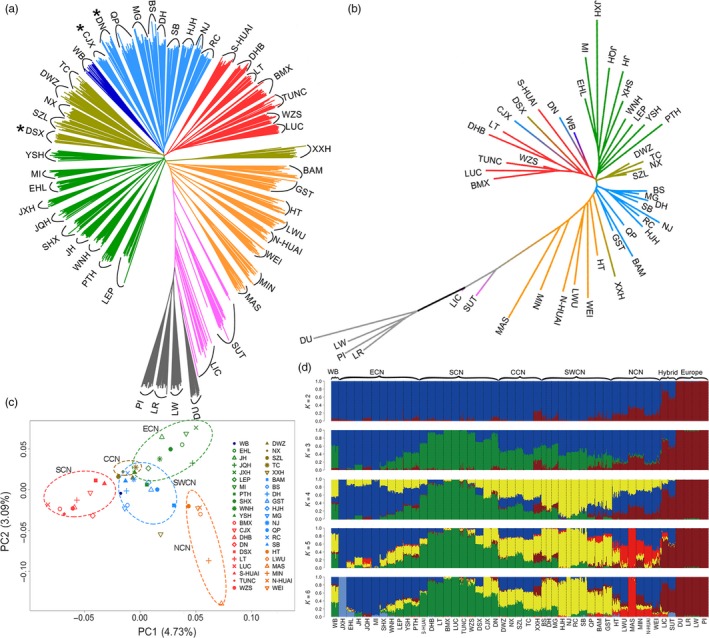
Phylogenetic relationships and population structure of Chinese indigenous pigs. (a) Neighbor‐joining (NJ) phylogenetic tree of 709 pigs tested in this study. The NJ tree was constructed using pairwise identical‐by‐state values among these 709 individuals (Materials and Methods). Three breeds (CJX, DN, and DSX) that were classified into different ecotypes in a ‐based phylogenetic tree (b) are indicated by asterisks. (b) NJ phylogenetic tree of 47 Chinese and Europe domestic breeds and wild boars. The NJ tree was constructed by pairwise values among these breeds (Materials and Methods). (c) Principal component plot of Chinese breeds and wild boars. Each figured point represents the average eigenvector of one breed. The first (PC1) and second components (PC2) are shown. Color codes for different ecotypes are as in Figure 1. (d) Population structures were inferred using ADMIXTURE with the assuming number of ancestral cluster K from 2 to 6. Each color represents one ancestral cluster and each vertical line represents one pig. The length of the colored segment in each vertical indicates the individual estimated fractional membership for each cluster. Breeds are separated by black dotted lines. Abbreviations for breeds and their ecotypes are given in Table 1
