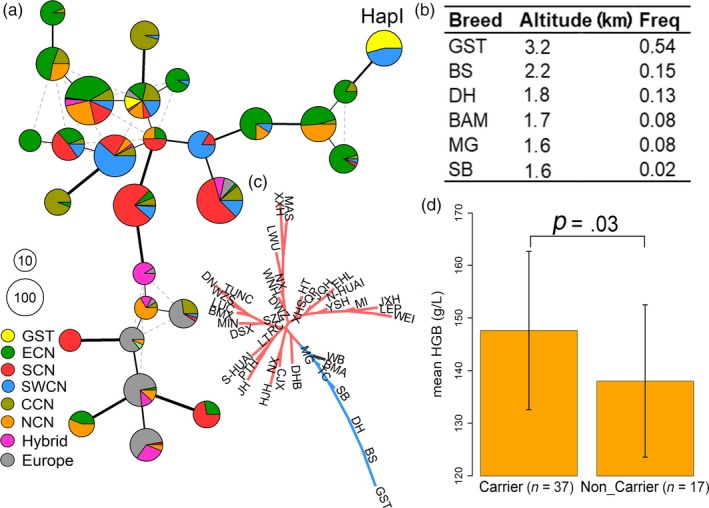
Figure 5.

Selective signals at the EPAS1 locus. (a) Network of EPAS1 haplotypes with frequencies of greater than 10. The haplotypes were defined from 26 SNPs within the EPAS1 region of 38.46 kb. Each pie chart represents one unique haplotype and the radius of pie chart is proportional to the number of each haplotype. The sections in the pie provide the breakdown of the haplotype representation among populations (ecotypes). The line width and length represent the variations between haplotypes. Different colors indicate different ecotypes. The major haplotype in Tibetan pigs in Gansu provicne (GST) is labeled by text HapI. Color codes for ecotypes are as in Figure 1. Abbreviations for breeds and their ecotypes are given in Table 1. (b) Frequencies of HapI in GST and other breeds. (c) Neighbor‐joining phylogenetic tree of 42 Chinese breeds and wild boars based on 26 SNPs in the EPAS1 gene. (d) Association of HapI with the concentration of hemoglobin (HGB) in GST
