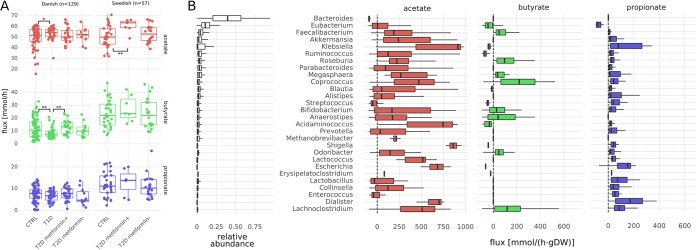
FIG 5.
SCFA fluxes. (A) Production capacities of the major SCFAs stratified by population. Fluxes denote total amount of SCFA produced by 1 g of bacterial biomass in the gut. Values that were significantly different by Welch’s t test are indicated by bars and asterisks as follows: *, P < 0.05; **, P < 0.01. (B) Genus-specific fluxes for the three major SCFAs. Only genera with a relative abundance of >1% are shown. Fluxes denote total production/consumption for each genus (see Materials and Methods) and are directed toward exports. Flux is shown in millimoles per hour per gram (dry weight). Thus, positive fluxes denote production of the metabolite, and negative fluxes denote consumption. Genera are ordered by average relative abundance (relative abundances are shown in the first column) from top to bottom.

