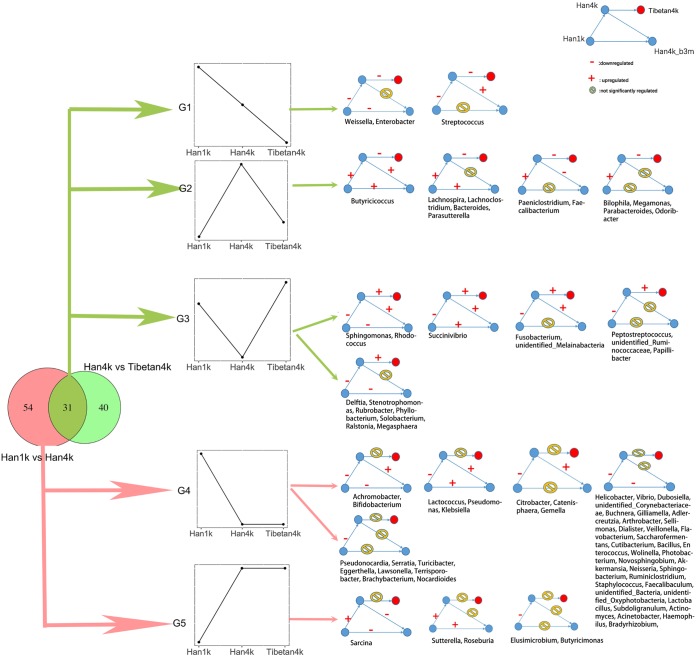
FIG 4.
Dynamic changes in genera between different groups. The Venn diagram on the left shows the number of differentially abundant genera between Han1k and Han4k (left) and between Han4k and Tibetan4k (right) as well as the overlap between these genera. Five groups (G1 to G5), representing different change trends in the Han1k, Han4k, and Tibetan4k groups, are shown in the middle. On the right, a detailed changing trend in the Han1k, Han4k, Han4k_b3m, and Tibetan4k groups is presented with genera shown. Red dots, Tibetan4k; −, downregulated; +, upregulated; yellow circles with diagonal bars, no significant difference between two sample groups. The genera are listed in each group.

