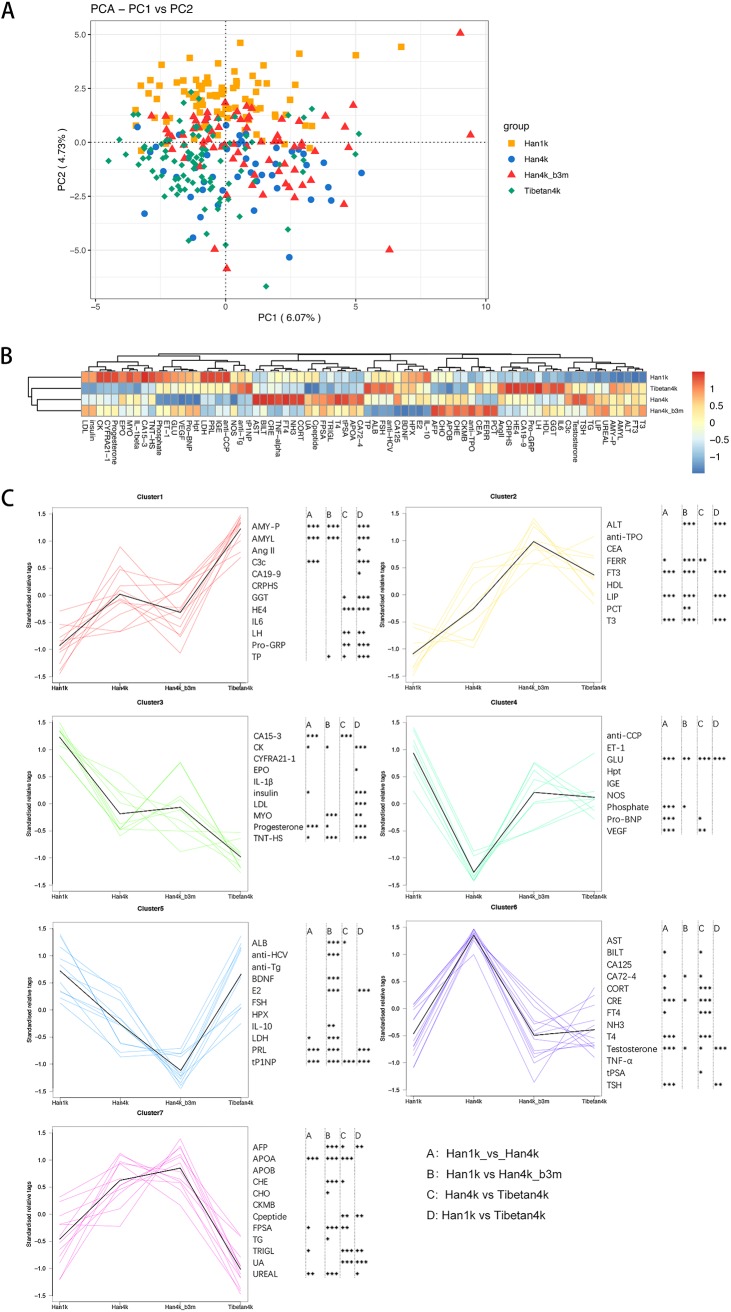
FIG 6.
PCA and heat map of the groups based on the clinical parameters and the trend for clinical parameters among the Han1k, Han4k, Han4k_b3m, and Tibetan4k groups. (A) PCA plot of the Han1k, Han4k, Han4k_b3m, and Tibetan4k groups based on all the clinical parameter data. (B) Heat map and hierarchical clustering of the groups based on all the clinical parameter data. Groups are shown on the y axis, while clinical parameters are shown on the x axis. (C) Trends among the groups based on the clinical indexes; k-means was used to cluster the clinical parameters. Han1k, Han4k, Han4k_b3m, and Tibetan4k are shown on the x axis accordingly, while the scaled abundance of clinical parameters is shown on the y axis. The Wilcoxon statistical significance is annotated on the right: A (comparison between Han1k and Han4k), B (comparison between Han1k and Han4k_b3m), C (comparison between Han4k and Tibetan4k), and D (comparison between Han1k and Tibetan4k). *, P < 0.05; **, P < 0.01; ***, P < 0.001.

