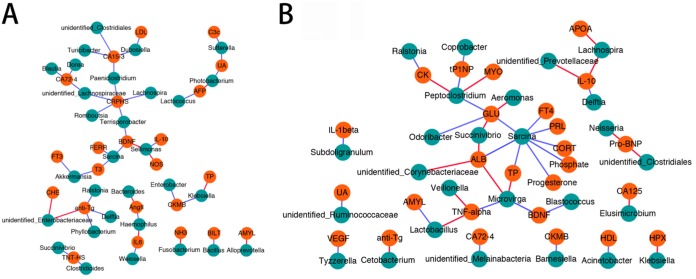
FIG 7.
Clinical indexes and gut microbiota networks in Han1k and Tibetan4k. Only connections between clinical indexes and the gut microbiota are shown in the networks. (A) Clinical indexes and gut microbiota network in Han1k. (B) Clinical indexes and gut microbiota network in Tibetan4k. Cyan dots, bacteria; orange dots, clinical parameters; blue connecting lines, negative correlations; red connecting lines, positive correlations.

