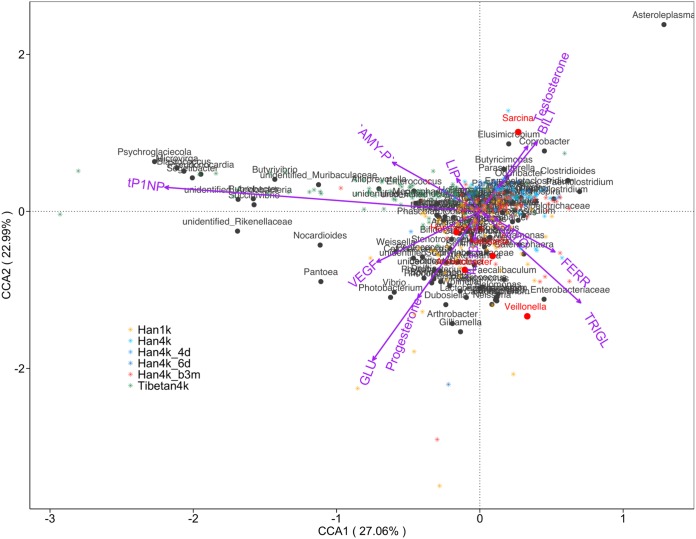
FIG 8.
Canonical correspondence analysis of the clinical indexes and bacterial composition. The graph shows the relationships among samples (stars), clinical indexes (vectors), and bacteria (dots). The colors of the stars represent sample groups. The segment length of each blood clinical index indicates the strength of the association between the variable and the microbial community. Bacteria indicated by red dots were used in the XGBoost-based classification of Han1k and Han4k.

