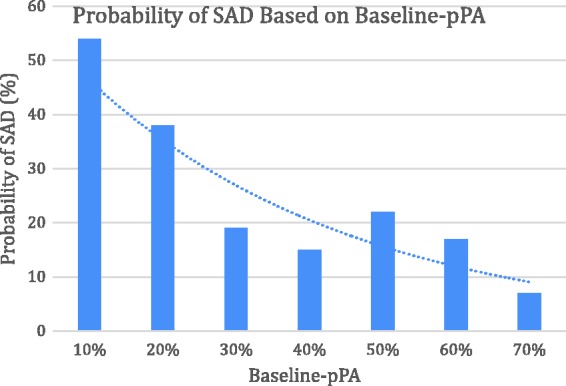
Figure 4.

Probability of SAD based on baseline-pPA. Logistic regression test was used with inadequate baseline-pPAs from Group B and C as the independent variable (x-axis) and probability of SAD (%) as the dependent variable (y-axis). The data showed that the lower the baseline PA, the higher the probability of SAD (odds ratio = 2.02, 95% CI: 1.15–3.57, P = .01, n = 37). pPA, percentage of protective (≥1.3 µg/mL) pneumococcal antibody serotypes to total tested serotypes; SAD, specific antibody deficiency.
