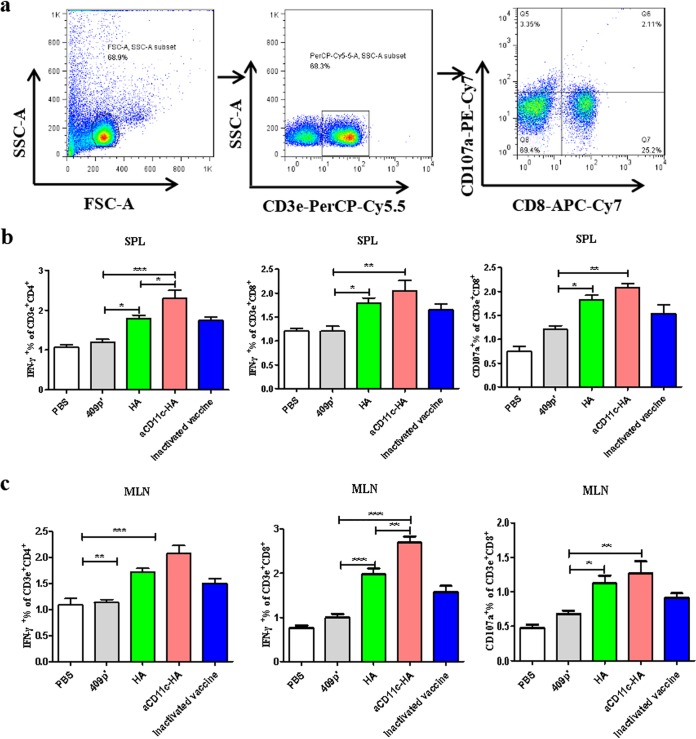
FIG 5.
T cell immune responses in vivo. (a) HA-specific cytokine secretion from splenocytes and MLNs was measured by FCM after oral immunization. The percentages of HA-specific CD4+ IFN-γ+ T cells, CD8+ IFN-γ+ T cells, and CD8+CD107a+ T cells from the spleen (b) and MLN (c) were detected by using FCM. The mean values ± the SEM of three independent experiments are shown. The statistical significance was calculated by using one-way ANOVA (*, P < 0.05; **, P < 0.01; ***, P < 0.001).

