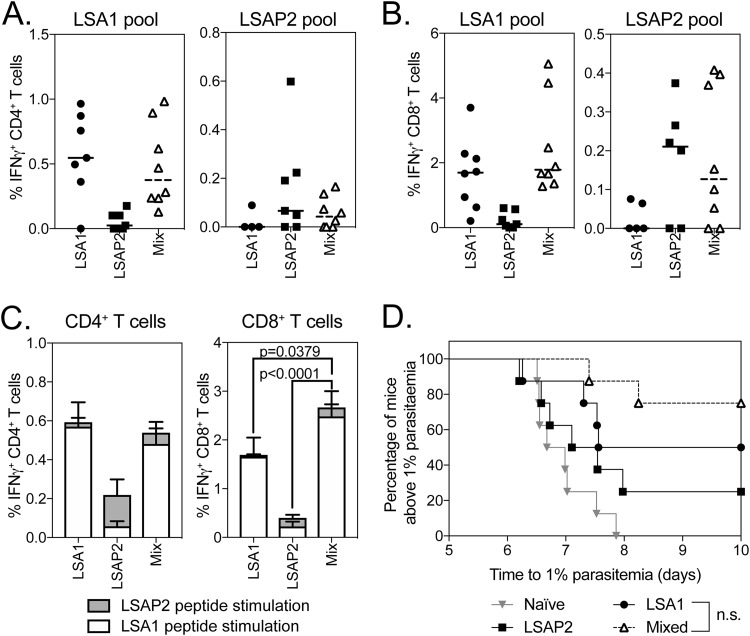
FIG 3.
Immunogenicity and efficacy of coadministration of PfLSA1 and PfLSAP2. (A to C) BALB/c mice (8 per group) were vaccinated with 108 IU ChAd63 expressing PfLSA1, PfLSAP2, or both vaccines mixed (Mix), resulting in a total virus dose of 2 × 10⁸ IU. A blood sample was taken on day 14, and PBMCs were analyzed by ICS after stimulation with a PfLSA1 or PfLSAP2 peptide pool. At day 17 postvaccination, the mice were challenged with 1,000 chimeric P. berghei sporozoites expressing PfLSA1 and PfLSAP2 and monitored for development of blood-stage malaria. The graphs represent the frequency of blood CD4+ IFN-γ+ (A) or CD8+ IFN-γ+ (B) T cells or summed CD4+ IFN-γ+ or CD8+ IFN-γ+ T cell responses (C). The bars represent median response; error bars indicate standard error of the mean. (D) Time to reach 1% parasitemia plotted on a Kaplan-Meier survival curve. The data points indicate individual mice, and the horizontal lines show the median response per group.

