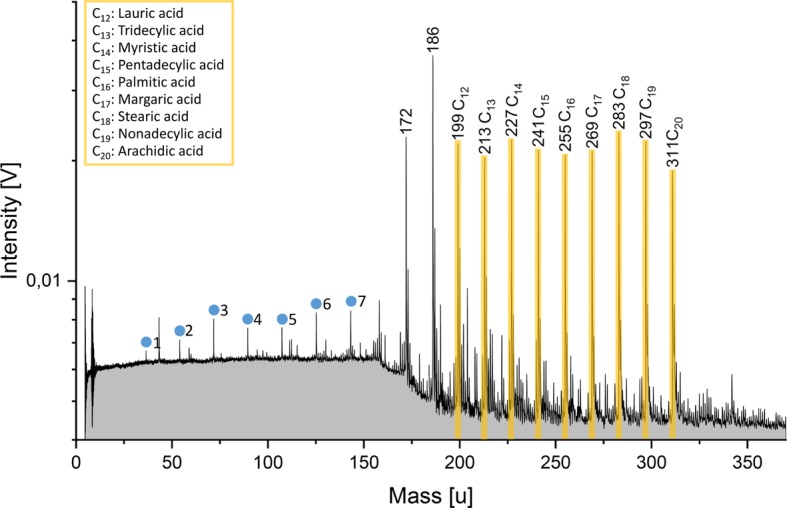
Fig. 4.

Anion mass spectrum (y-axis in logarithmic scale) of fatty acids at equal concentrations of in a water-acetonitrile matrix (50/50 vol.-%) simulating ice grain impact velocities of . The respective carbon numbers of the fatty acid molecules are labelled above the peaks. Deprotonated molecular peak intensities (yellow) are approximately equal, consistent with the equal fatty acid concentrations. Peaks of the form [(H2O)nOH]− are observable due to the watery matrix (blue circles). The respective is labelled besides the peaks (figure taken from Klenner et al. 2020a)
