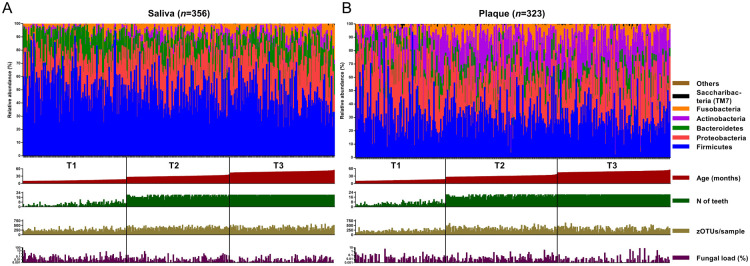
Figure 1.
Taxonomic distribution of the relative abundance of reads of major bacterial phyla in (A) salivary and (B) plaque samples of children at all time points (T1, T2, T3). The samples are ordered according to the age of the participants (T1: 9 to 15.9 mo of age; T2: 25.1 to 35.7 mo of age, T3: 42.9 to 53.8 mo of age) at the time of the sample collection (red bars below the taxonomy plots). Green bars indicate the number of teeth present (range, 0 to 20) at the time of the sample collection. Species richness (number of zero-radius operational taxonomic units/sample) of each sample (range, 66 to 629) is indicated with mustard-colored bars, and the fungal load (percentage of fungal DNA/bacterial DNA) of each sample (range, 0 to 10.9) is shown as purple bars below the respective taxonomy plots.

