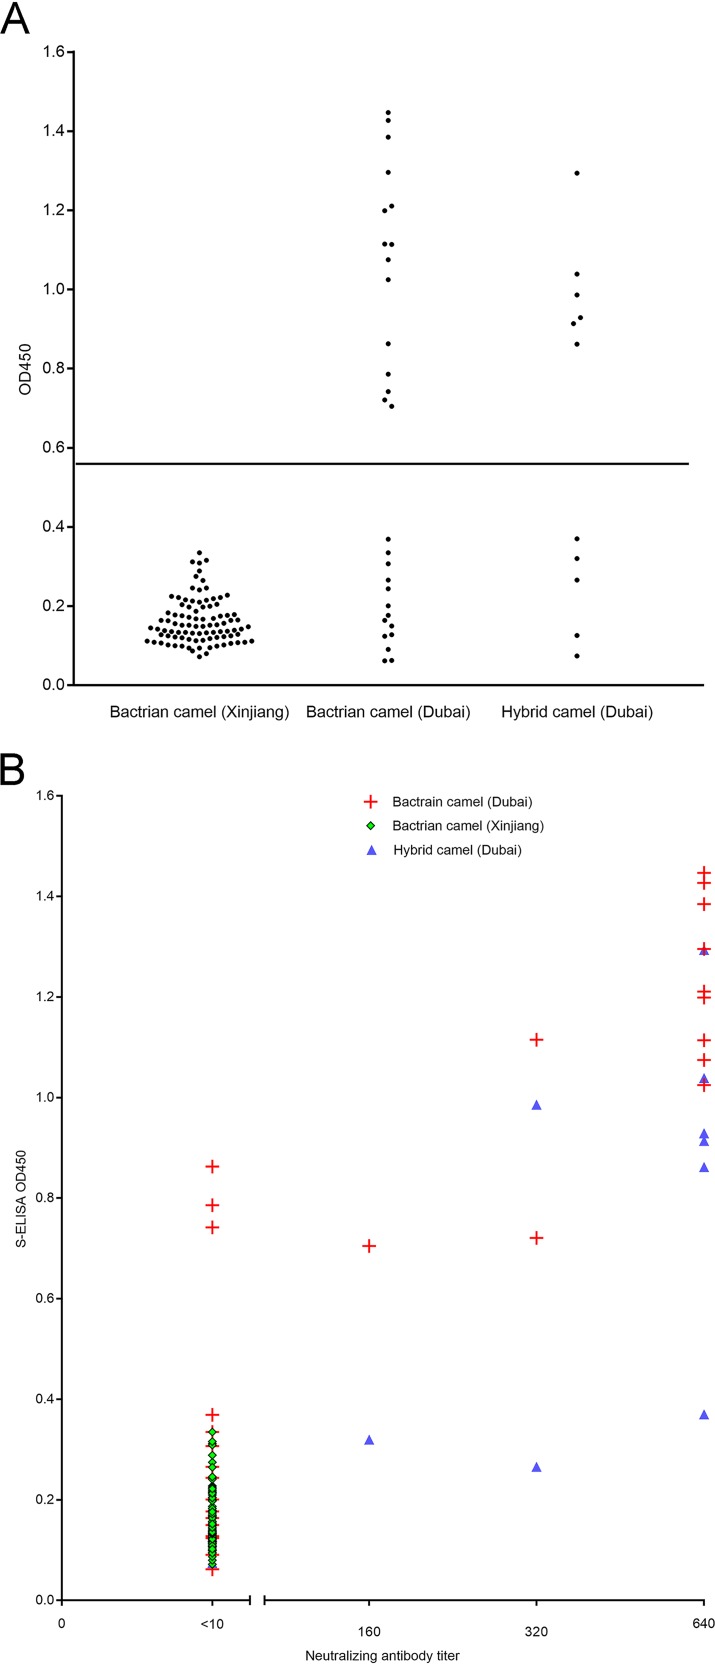
FIG 2.
(A) Scatter plot showing MERS-CoV antibody levels detected using S-ELISA in Bactrian and hybrid camel sera from Dubai and Xinjiang. The test results were plotted as optical density at 450 nm (OD450) values. The horizontal line indicates the cutoff value (0.557) for positive diagnosis. (B) Scatter plot showing correlation between antibody levels detected using S-ELISA and neutralizing antibody titers of Bactrian and hybrid camel sera for MERS-CoV.

