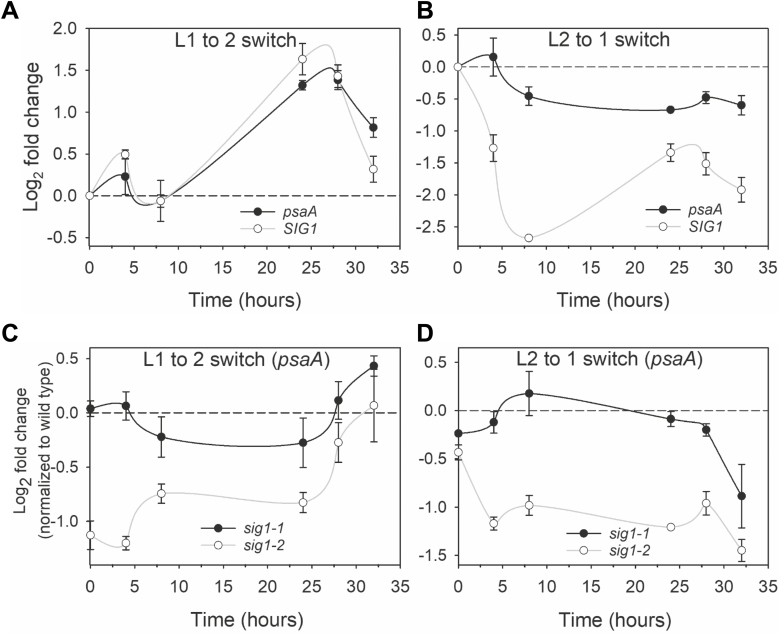
Fig. 4.
Transcript accumulation kinetics of psaA and SIG1 genes. (A and B) Transcript accumulation kinetics of psaA and SIG1 in the wild type as quantified with qRT-PCR. Experimental conditions are switch from light 1 (L1) to light 2 (L2), and vice versa. The log2 fold change in transcript abundance is plotted against time. The time point at which lights are switched is taken as zero time and the concomitant up- or down-regulation is calculated by taking the expression at the time of light switch (zero time) as baseline. (C and D) Transcript accumulation kinetics of psaA in sig1 mutants. Each data point represents log2 fold change relative to the wild-type control. Error bars represent ±SE of the mean of three biological replicates.

