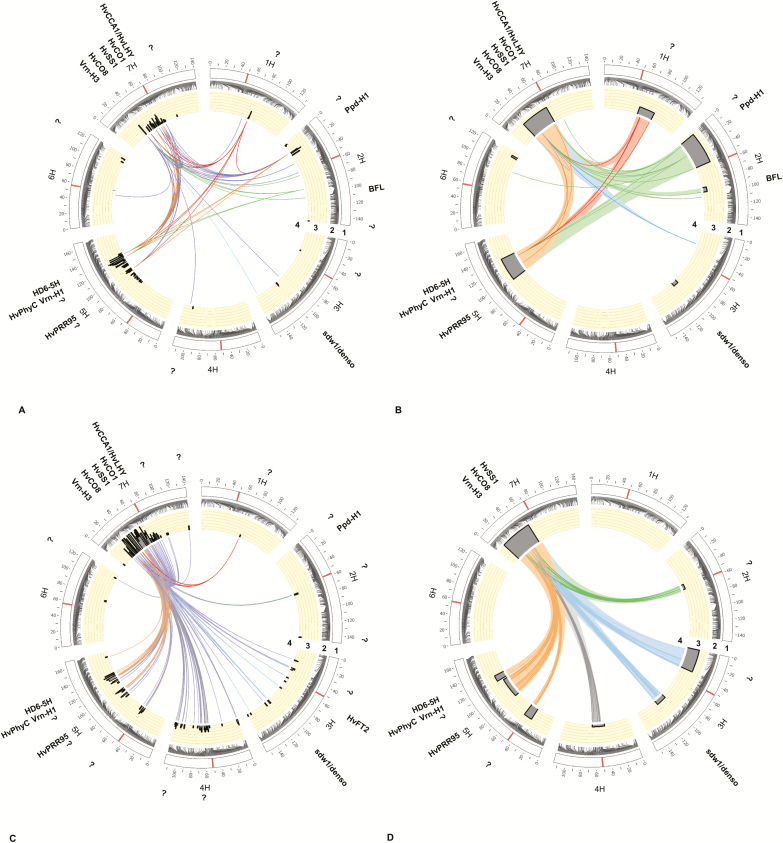
Fig. 3.
Genetic composition of flowering time in a spring barley MAGIC population under field conditions, (A) single SNP approach and (B) haplotype approach, and under foil tunnel conditions, (C) single SNP approach and (D) haplotype approach. The candidate genes that might correspond to QTLs and digenic interactions are indicated outside the plots. 1, Barley chromosomes are shown as white bars and centromeres are highlighted within these bars. 2, Genetic position of SNPs on the chromosomes. 3, Probability of QTLs detected with P≤0.001 and 1000 permutations plus cross-validation via multilocus QTL analysis are shown as peak SNPs in SA and peak SNPs/interval (blocks) in HA. 4, Bridges in the center of each circle represent detected digenic interactions between SNP markers with P≤0.1E-15 via cross-validated multilocus epistatic interaction analysis. Question marks indicate loci where no genes for flowering time have been reported so far. Plots were drawn by Circos (Krzywinski et al., 2009). (This figure is available in colour at JXB online.)

