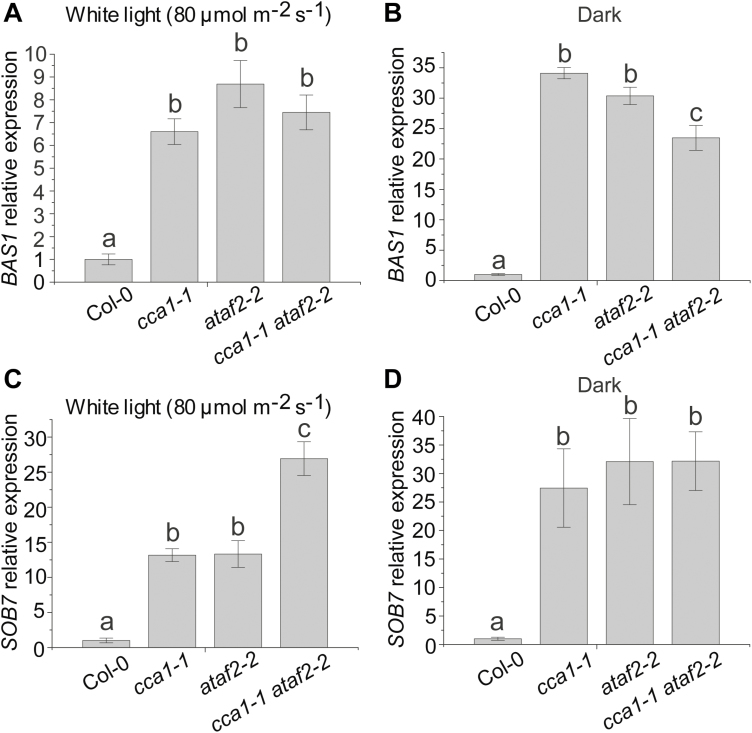
Fig. 4.
CCA1 and ATAF2 differentially suppress the transcript accumulation of BAS1 and SOB7. For 4-day-old seedlings grown at 25 °C in 80 μmol m−2 s−1 continuous white light (A) or darkness (B), cca1-1, ataf2-2, and the cca1-1 ataf2-2 double mutant showed similarly elevated BAS1 expression when compared with the wild type (Col-0) except that cca1-1 ataf2-2 showed even lower BAS1 transcript accumulation than either single mutant in the dark. In contrast, in white light, the cca1-1 ataf2-2 double mutant conferred significantly higher SOB7 transcript accumulation than either cca1-1 or ataf2-2 single mutants (C). However, in darkness, the genetic impact of CCA1 or ATAF2 on SOB7 transcript accumulation is similar and has no additive effect (D). Each qRT–PCR value is the mean of results from three biological replicates×three technical replicates (n=9). Error bars denote the SE. One-way ANOVA with Tukey’s HSD test was used to determine the significance of differences. Groups with significant differences were labeled by different letters.

