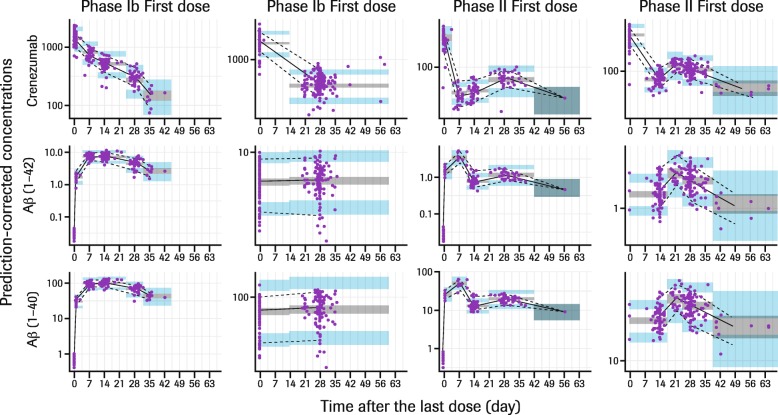
Fig. 6.
Prediction-corrected visual predictive check plots. Phase Ib, data from GN29632 study; phase II, data from ABBY and BLAZE studies. Circles represent observed data. Solid and dashed lines represent median and 90th percentiles of observed data, respectively. Gray and blue shaded areas represent simulated 90% prediction interval of median and 90th percentiles, respectively. Abbreviations: Aβ beta-amyloid, Ph phase

