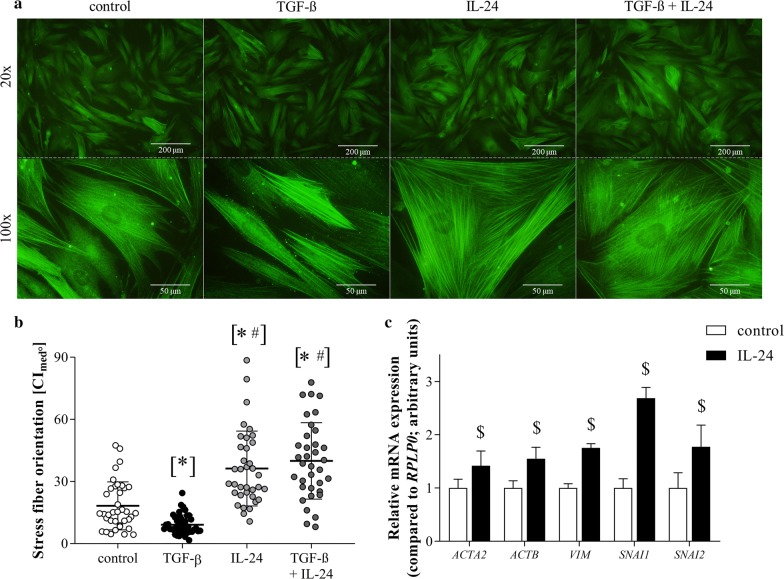
Fig. 5.
Effect of IL-24 treatment on the stress fiber orientation of pdMFs. α-SMA immunopositive stress fibers was visualized by immunofluorescence staining (green) (a). The orientation of stress fibers was assessed by graphical analysis (b) using ImageJ 1.48v software. Plots represent the width of 95% confidence intervals of the measured angels between stress fibers and the long axis of the investigated cell (n = 35–40). Horizontal lines indicate mean ± SD. Scale bar: 200 µm or 50 µm. Relative mRNA expression of ACTA2, ACTB, VIM, SNAI1 and SNAI2 (c) was determined by real-time RT-PCR (n = 5) in comparison with RPLP0 as internal control. Results are presented as mean + SD. *p < 0.05 vs. control (Kruskal–Wallis test), #p < 0.05 vs. TGF-β (Kruskal–Wallis test). $p < 0.05 vs. control (Mann–Whitney U-test)

