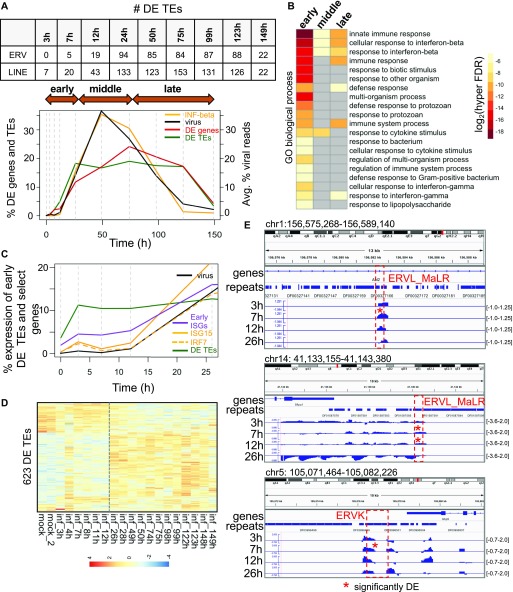
Figure 4. TEs are up-regulated very early during influenza A virus (IAV) infection, peaking before significant changes in IFN-β gene expression.
(A) Percentages of DE genes (up and down-regulated), DE TEs (up and down-regulated), IFN-β expression (percent of CPM expression), and viral reads (% reads corresponding to IAV in each sample) during a 7-d mouse IAV time course, scaled relative to the total over the time course. Vertical dashed grey lines indicate the time points. The table above the plot shows the number of DE ERV and DE LINE elements at each time point. (B) Biological process GO terms corresponding to genes proximal to DE TEs that are expressed in the early, middle, and late stages of infection. (C) Percentage of early DE TEs (up at 3, 7, and 12 h), early interferon-stimulated genes (ISGs) (up at 3, 7, and 12 h; purple line), Isg15 (solid orange line), Irf7 (orange dashed line), and virus expression (CPM) over the time course, normalized by their expression totals over the entire time course. (D) Heat map showing row-scaled, log2 (CPM expression) of 623 DE TEs that are up-regulated or down-regulated at some point during the IAV time course. (E) Genome viewer screenshots showing early DE ERV elements that are expressed within introns or downstream of genes. Time point tracks show log2(RPKM expression ratio of infected over mock-infected samples). The y-axis range is shown on the right.

