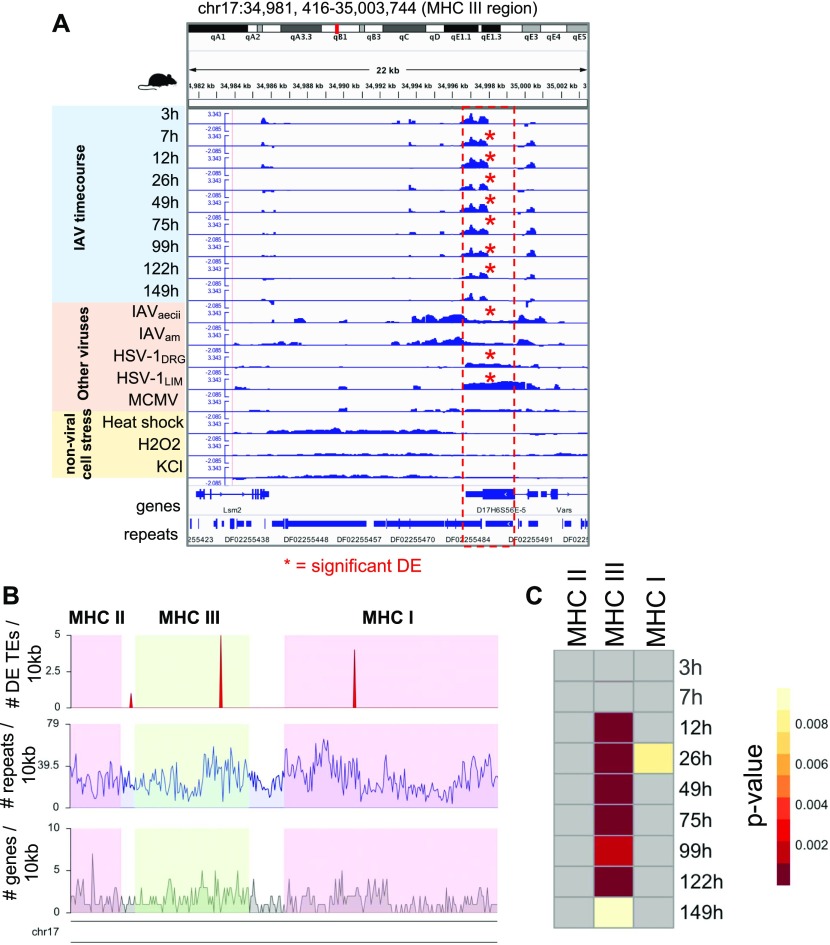
Figure 5. Early up-regulated TEs are enriched in the MHC III region during IAV infection time course.
(A) Genome viewer screenshot showing early up-regulation (12 hpi) of a RefSeq-annotated viral envelope protein located in MHC III and shared up-regulation with other mouse virus data sets. Each data set track shows bam-normalized coverage (RPKM, log ratio) of stressed samples (viral and nonviral stress) to unstressed samples. Red asterisks indicate DE; IAV time points are DE if FDR < 0.25, whereas other data sets are DE if FDR < 0.05. Y-axis for all tracks is −2.085–3.343. (B) Gene, repeat, and DE TE density in the MHC region of mouse (mm10) chromosome 17: 33860353-37090447. Pink and green shaded regions indicate the boundaries of the MHC regions selected for performing a Fisher’s exact test based on MHC gene annotations from Shiina et al (2017). (C) Heat map showing TE enrichment in MHC regions during the IAV time course. Grey cells have P-values of 1 (no TE enrichment).

