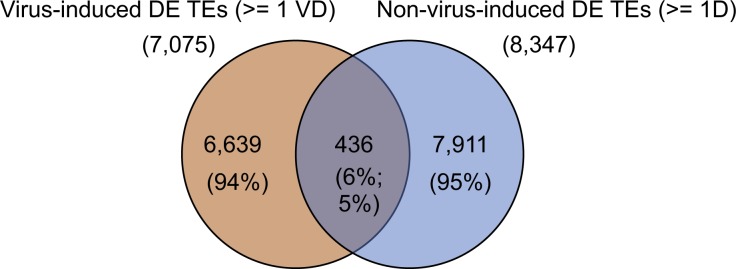
Figure S11. Few DE TEs are shared between viral and nonviral sources of cellular stress.
Venn diagram showing the total numbers of DE TEs (ERVs and LINEs) appearing across ≥1 mouse virus data sets (VD) and ≥1 nonvirus stress data (D) sets (oxidative, osmotic, and heat shock stress in mouse 3T3 fibroblasts) and the number of DE TEs that are shared between them.

