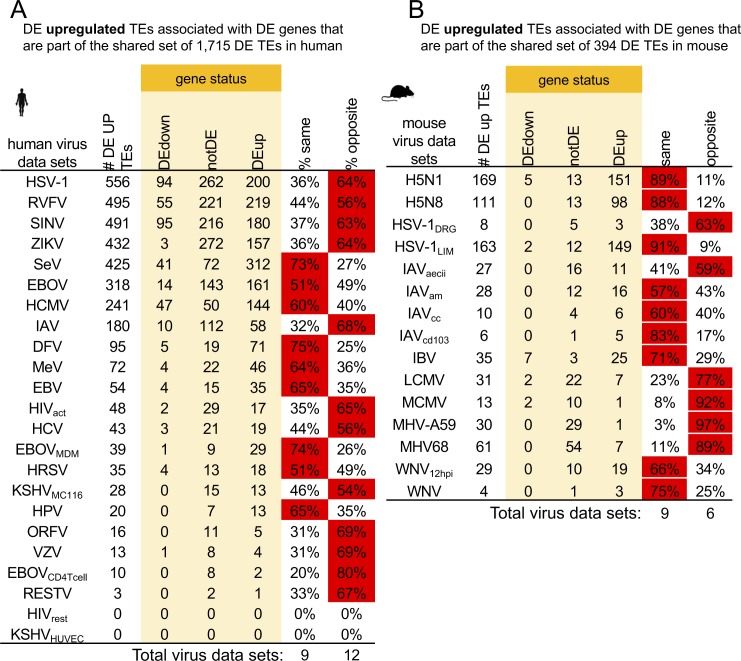
Figure S6. Differential expression status of genes neighboring shared DE TEs.
(A, B) Tables showing differential expression status of the genes that lie closest to shared DE TEs (up-regulated in ≥3 virus data sets) across virus data sets in (A) human and (B) mouse. Number of DE up-regulated TEs in each virus data set that match the shared set are reported in “# DE UP TEs” column along with the directions of nearest neighboring genes for each virus data set (yellow shaded columns). If genes are in the same direction as TEs, they are reported in the % shared column. If a gene is either not DE or DE in the opposite direction, it is reported in the % opposite direction column. Red indicates that more than 50% of DE genes fall into that category.

