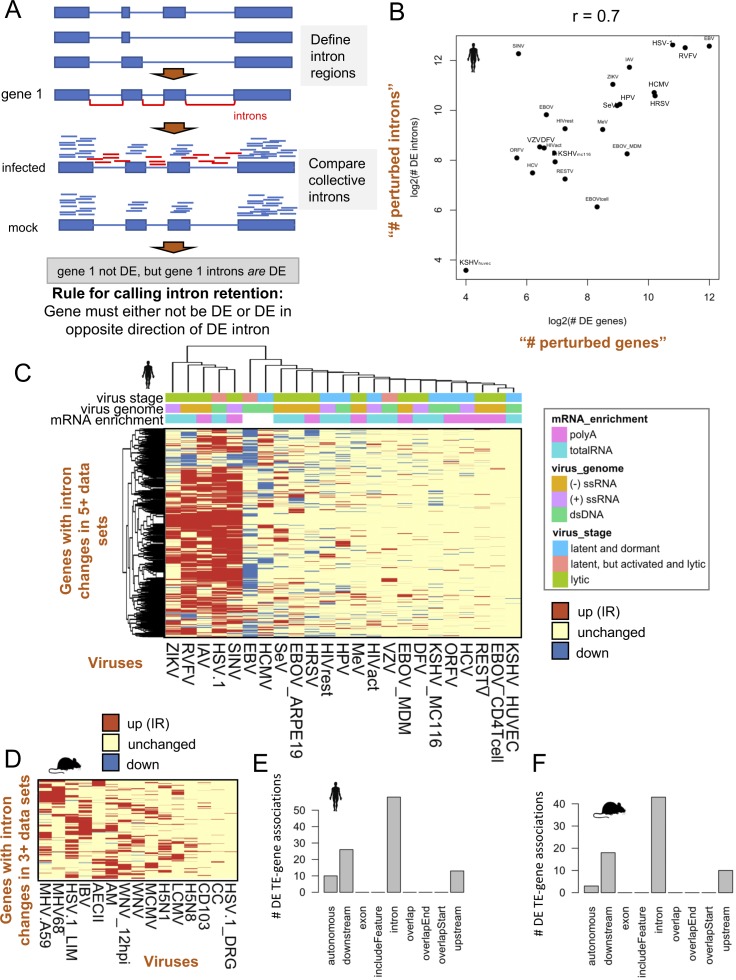
Figure S7. Intron retention becomes increased upon infection for multiple viruses and is correlated with the degree of gene expression perturbation.
(A) Method showing how intron retention was quantified. Briefly, intron regions not overlapping any annotated exons were defined and reads overlapping these regions were quantified for each gene. Intron and gene expression were quantified simultaneously with edgeR and different significance thresholds were applied to genes and introns. Only significant introns that have non-DE genes or DE genes that are DE in the opposite direction of the intron were quantified as likely cases of gene intron retention. (B) Scatterplot showing a strong relationship between the of numbers of DE genes (“perturbed genes”) versus the number of genes with DE introns (“perturbed introns”) on a log2 scale. (C) Heat map showing 1,288 genes with shared significantly increased intron retention across ≥5 human virus data sets. Red indicates increased intron retention, blue indicates decreased intron retention, and yellow indicates no change in intron expression between infected and mock-infected samples. (D) Heat map showing 380 genes with shared significantly increased intron retention across ≥3 mouse virus data sets. (E) Bar plot showing the relationships of 79 human DE TEs that overlap FANTOM 5 cage regions with genes. There are a total of 107 TE–gene relationships shown because TEs can have a relationship with more than one gene. Upstream and downstream are defined as within 3 kb from the transcriptional start site and termination site, respectively. Autonomous is defined as being greater than 3 kb from annotated ENSEMBL gene boundaries. (F) Bar plot showing the relationships of 59 mouse DE TEs that overlap FANTOM 5 cage regions with genes (74 TE–gene associations).

