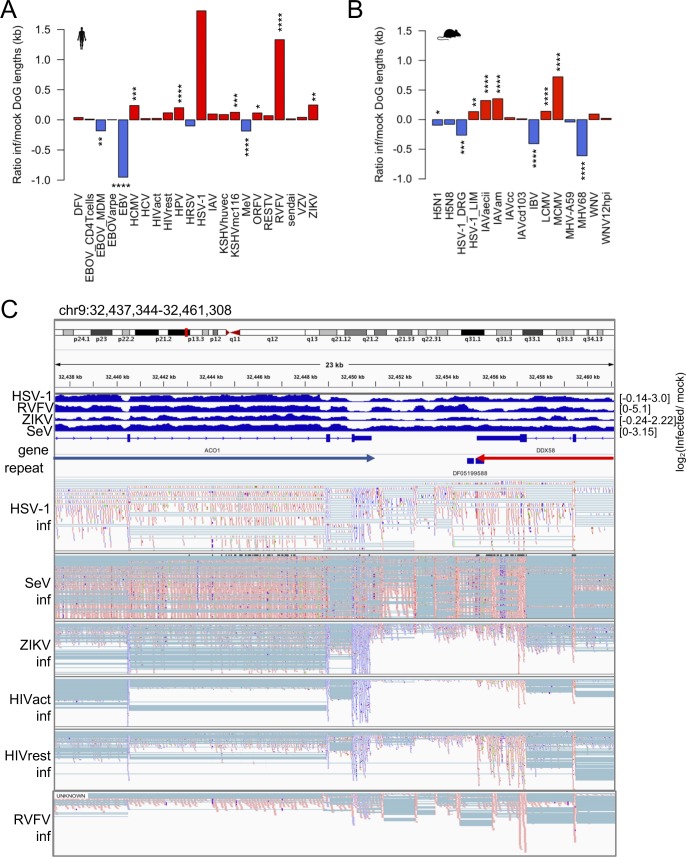
Figure S8. TR lengths are affected by virus-induced stress.
(A) Log2 ratio of human infected- to mock-infected cell TR region (DoG) lengths that were identified with DoGFinder for each virus data set. Readthrough lengths are reported in kilobases. Asterisk indicates significant differences between infected and mock-infected readthrough lengths. Human HSV-1 and IAV were not significant because of high variances and low number of replicates. *P < 0.05, **P < 0.01, ***P < 0.001, and ****P < 0.0001. (B) Same as (A) but for mouse virus data sets. (C) Genome viewer screenshot showing an example of where one of two expressed genes, oriented opposite to one another, has TR into the boundaries of the other gene; the gene on the right (DDX58) shows considerable TR into the ACO1 gene, which may be interpreted as intron retention in the ACO1 gene using our methods. Top virus tracks show bam RPKM-normalized coverage (log ratio) between infected and mock-infected samples. Blue reads indicate forward strand mapping and red reads indicate reverse strand mapping. Arrows between the gene and repeat tracks show the transcriptional direction of the genes.

