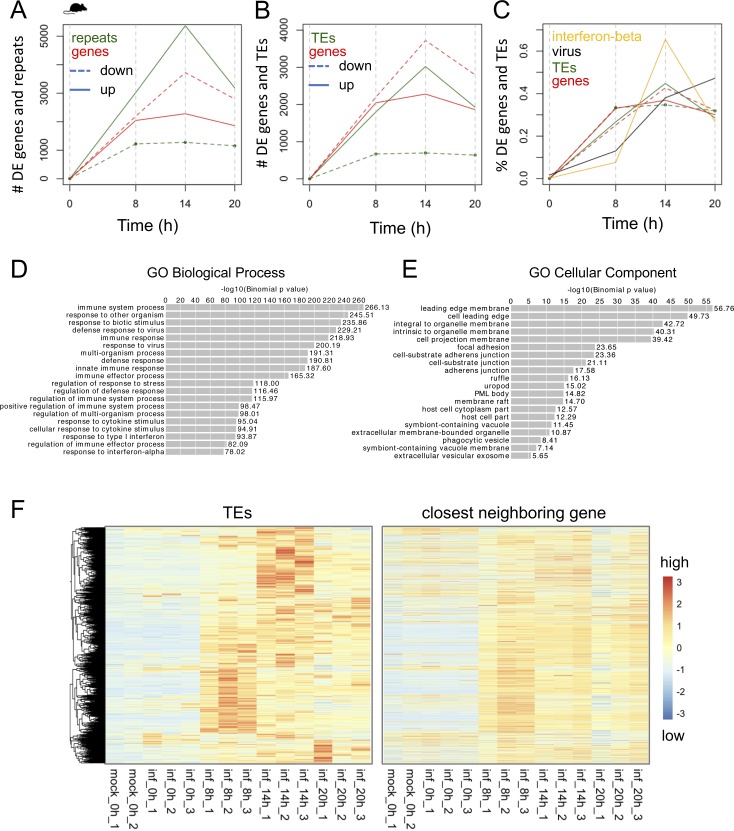
Figure S9. TE and gene changes during 20-h mouse norovirus (MNV) infection time course in RAW 264.7 cells.
(A) Number of DE genes (red) and repeats (green) that are up- and down-regulated during MNV infection at 0, 8, 14, and 20 h. (B) Number of DE genes (red) and TEs (green) that are up- and down-regulated during MNV infection at 0, 8, 14, and 20 h. TEs include ERVs and LINEs. (C) Percent of DE genes and DE TEs over the time course. Percent reads derived from virus, and % of IFN β expression are also plotted. IFN β is DE at 8 h (FDR = 1.65 × 10−76). (D, E) GREAT GO Biological Process and GO Cellular Component terms for genes that are near DE TEs that become up-regulated during the first 20 h of MNV infection (GREAT default). (F) Heat maps showing expression of 3,840 DE TEs that become up-regulated, as well as the expression of the closest neighboring genes during the 20-h MNV infection in RAW 264.7 cells. Expression is in CPM and row-scaled.

