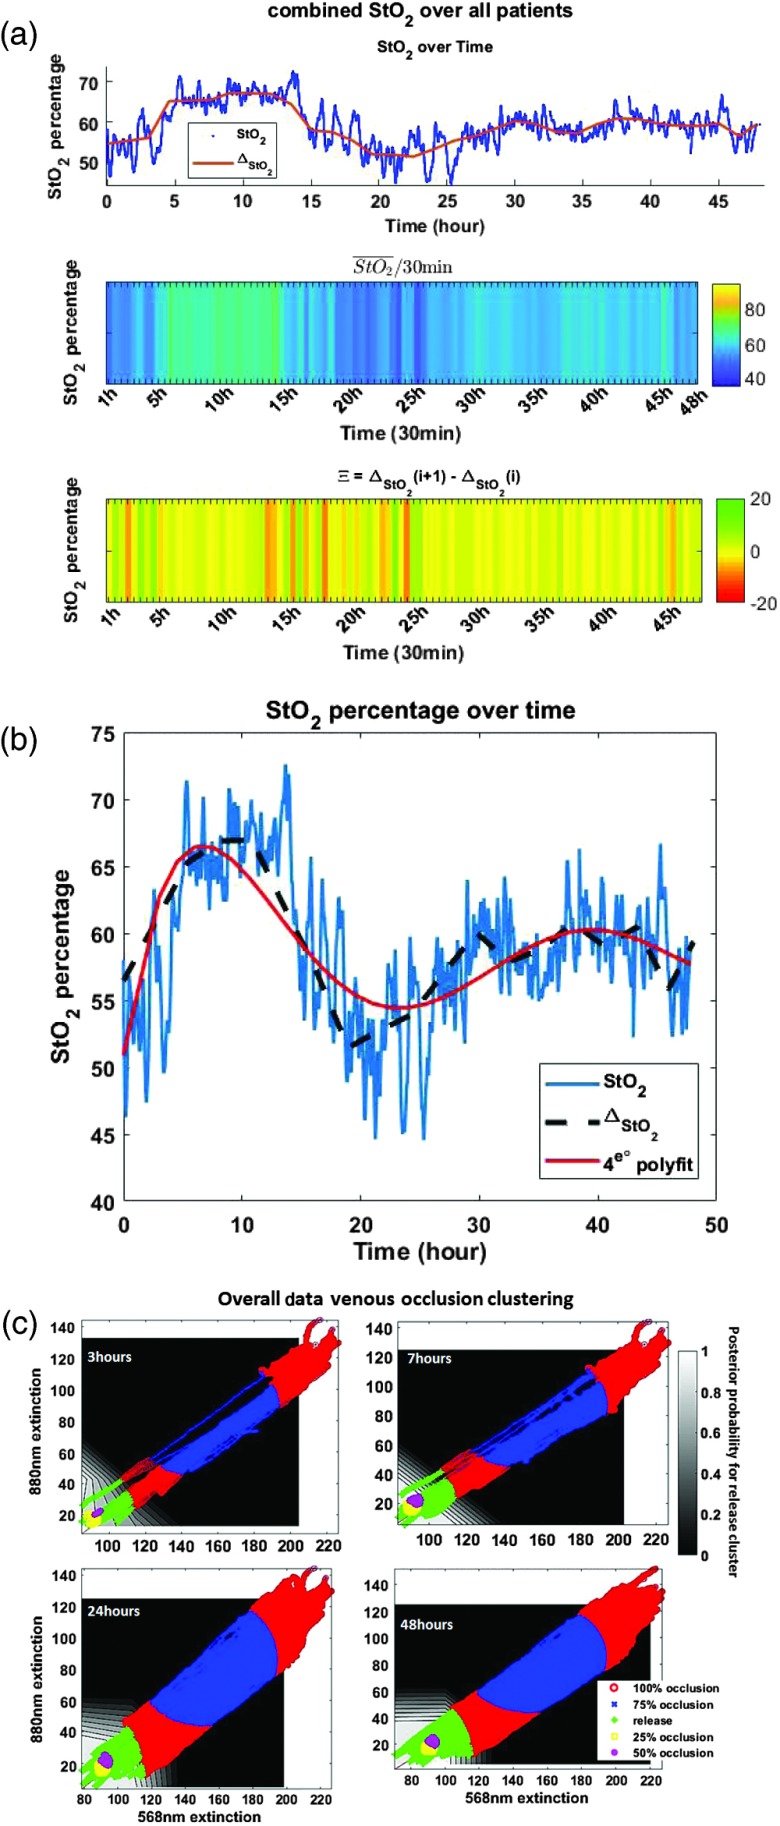
Fig. 4.
percentage and naive Bayes classification results using overall patients’ data. After time synchronization of all datasets, data are analyzed and processed. (a) percentage results using the combined datasets of all patients. (b) Combined results of all patients. (c) Naive Bayes classification using the combined and HHb datasets of all patients.

