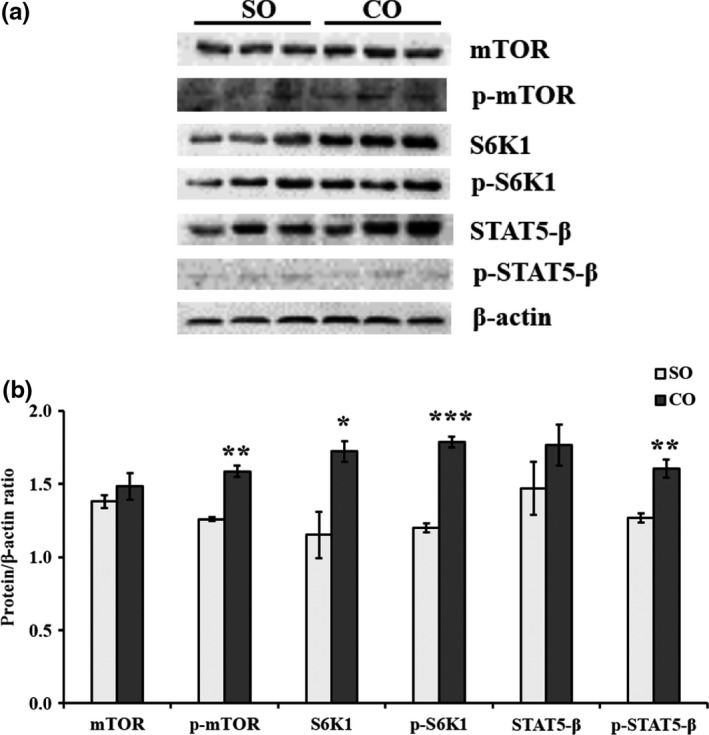
Figure 5.

Protein levels of mTOR, phosphorylated (p‐)‐mTOR, S6K1, p‐S6K1, STAT5‐β, and p‐STAT5‐β in MAC‐T cells treated with camellia seed oil. Representative Western blot images for mTOR, p‐mTOR, S6K1, p‐S6K1, STAT5‐β, and p‐STAT5‐β in MAC‐T cells are shown in (a). Protein to β‐actin ratios are shown in (b). Data are mean ± SEM (n = 3); * and *** indicate significant differences compared with the control (MAC‐T cells treated with SO) at p < .05 and p < .001, respectively. SO: soybean oil, CO:camellia seed oil
