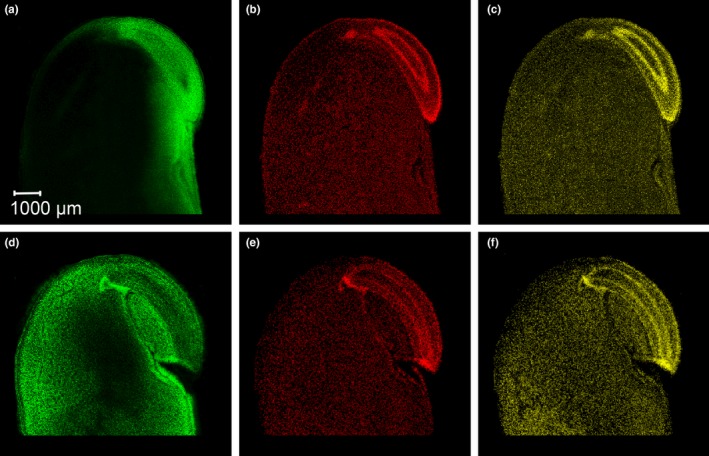
Figure 2.

MS images revealing the distribution of arginine m/z 175.11895 [M + H]+ (a, d; green color), spermidine m/z 146.16517 [M + H]+ (b, e; red color), and spermine m/z 203.22302 [M + H]+ (c, f; yellow color) in cross sections of soybean seeds for genotypes GP7X‐1871 (upper row of pictures) and SOJA‐1902 (lower row), respectively
