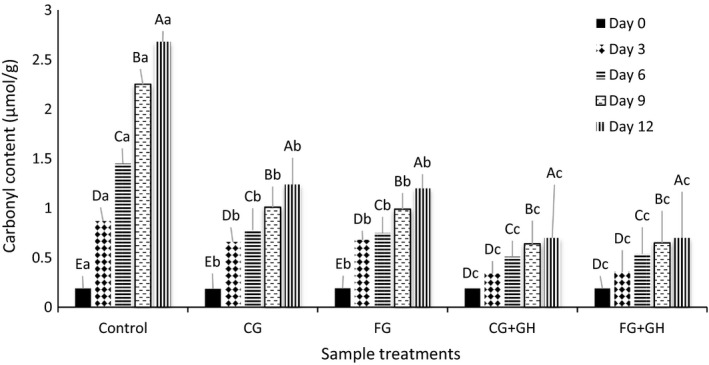
Figure 1.

Protein oxidation process of samples during 12 days of storage at 4°C. Data are plotted based on mean values. The different uppercase and lower case letters show significant difference of carbonyl content during storage time and different samples, respectively
