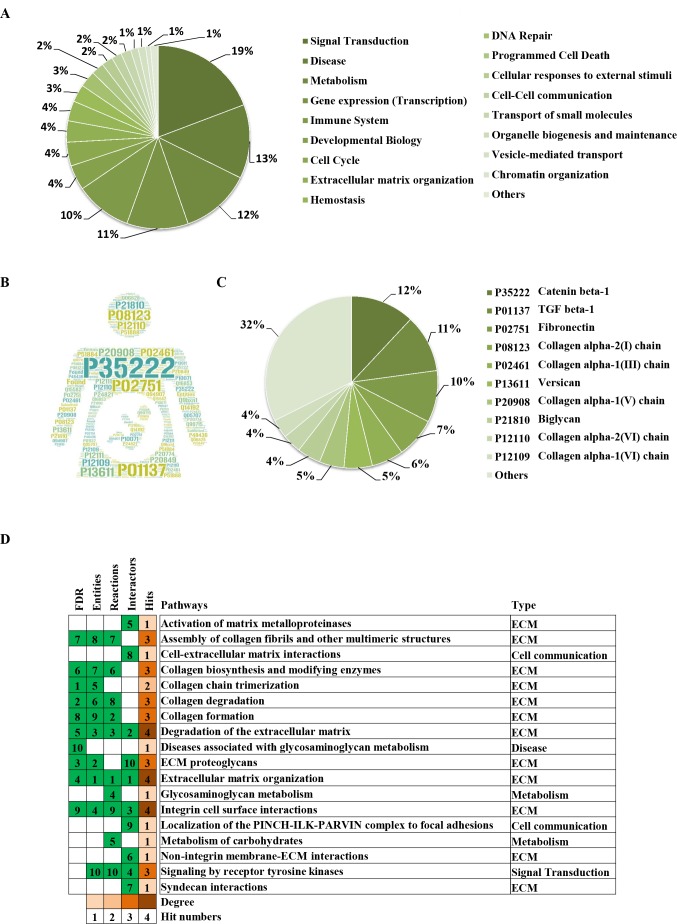
Figure 3. Classification statistics of significantly enriched pathways by REAC shown in Fig. 2B.
Enrichment analysis methods are described in the Materials and Methods section. (A) Distribution of the enrichment pathways. (B) High frequency molecules in all of the significant signaling pathways were mapped by Wordart software (https://wordart.com). The larger the word frequency was, the larger the font size. (C) The top 10 proteins involved in enrichment pathways and their proportions. (D) The top 10 signaling pathways. Four columns on the left are the results of the top 10 FDR, entities, reactions and interactors. The numbers are their ranks. The hit numbers for each pathway are shown in column 5.

