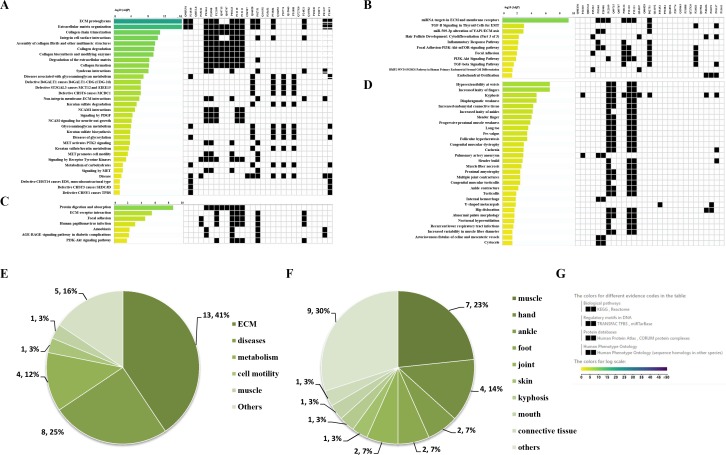
Figure 4. Signaling pathway enrichment analysis by g:Profiler in the REAC, WP, KEGG and HP databases.
Signaling pathway enrichment analysis by g:Profiler in the (A) REAC, (B) WP, (C) KEGG and (D) HP databases. Statistical results of signaling pathways from REAC (E) and HP (F). (G) Graphical illustration.

