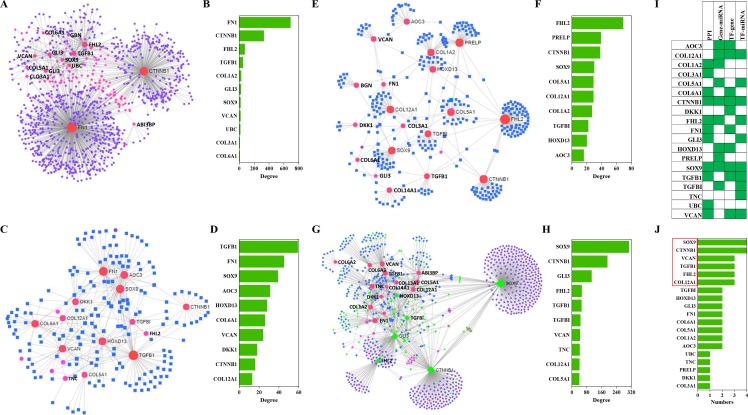
Figure 6. PPIs and GRNs analyses of these candidate protein-coding genes by NetworkAnalyst.
Generic PPI (A) and the top 10 genes (B) involved in that PPI. TF-gene interactions (C) and the top 10 genes (D)involved in these interactions. Genes are shown as pink circles, and transcription factors are shown as blue squares. Gene-miRNA interactome (E) and the top 10 genes (F) involved in these interactions. Genes are shown as pink circles and miRNAs are shown as blue squares. TF-miRNA coregulatory interactions (G) and the top 10 genes (H) involved in these interactions. Genes are circles. miRNAs are shown as blue diamonds. TFs are shown as green diamonds. The distribution (I) and frequency (J) of the top 10 genes in these four interaction networks mentioned above are shown.

