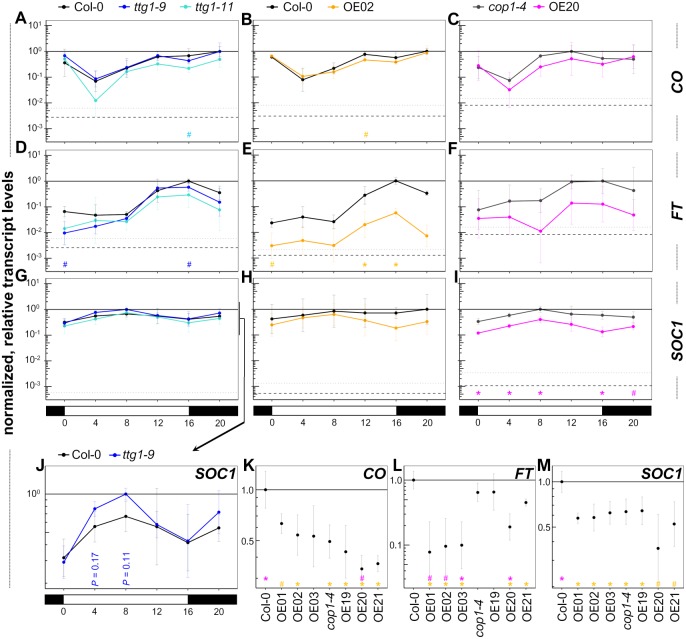
Figure 2. TTG1 overexpression suppresses FT and SOC1 transcript levels which can not be explained by CO transcript levels.
(A–J) Eight-day-old seedlings grown under LD conditions (light: ZT0-16, dark: ZT16-0) at 21 °C were harvested in 4h-intervals starting at ZT0. The analyzed genotypes were ttg1 mutants in Col-0 background, TTG1 overexpression lines in Col-0 (OE02) and in cop1-4 (OE20) background with their respective backgrounds. CO, FT and SOC1 transcript levels were analyzed. Transcript levels are presented relative to the UBQ10 transcript levels and normalized with the maximal mean per target within a genotype set. (K–M) Same growth conditions as used for A–J. The seedlings were harvested at ZT = 11 and ZT = 13 from OE01-03 (Pro35s:YFP-TTG1 (Col-0), three independent insertion lines) and OE19-21 (Pro35s:YFP-TTG1 (cop1-4), three independent insertion lines), Col-0 and cop1-4. Data are means from three biological replicates originating from three independent seed batches (A–J) or from one seed batch of parallely grown parental plants (K–M). Error bars are SD. Asterisks indicate significant differences (#P < 0.1, *P < 0.05) between the mutants (blue: ttg1-9, cyan: ttg1-11) and their background or the overexpression lines and their respective backgrounds Col-0 (orange) and cop1-4 (magenta). Dashed line: averaged lower threshold in the set of experiments for the respective target (Ct = 35) relative to the respective UBQ10 levels. Dotted line: average lower threshold + SD. The solid line equals 1. The y-axis is log10-scaled. See Table S3 for more details on the underlying data and statistics.

