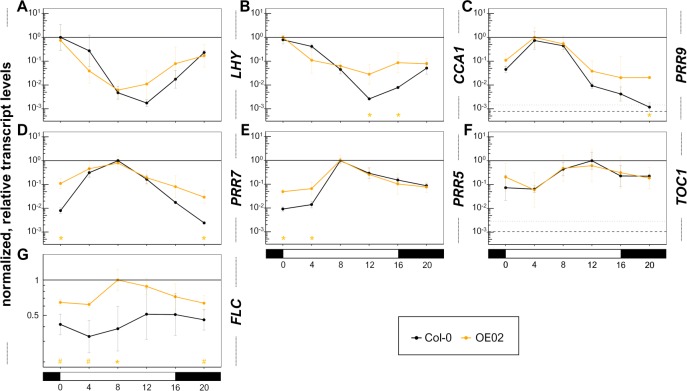
Figure 4. TTG1 can modulate transcript levels of circadian clock components, flattens their circadian amplitude and TTG1 overexpression increases FLC transcript levels.
To further explore an additional relevant part of the flowering time regulatory pathway, we used the overexpression line in Col-0 background to analyze eight-day-old seedlings grown under LD conditions (light: ZT0-16, dark: ZT16-0) at 21 °C which were harvested in 4 h-intervals starting at ZT0. (A–F) The analyzed clock components are sorted according to their peak during the day. (G) The selected overexpression line in Col-0 background (OE02) was also employed to further explore another relevant FT-suppressive branch of the flowering time regulatory pathway: FLC transcript levels. All transcript levels are relative to that of UBQ10 and normalized with the maximal mean per target. Data are means from three biological replicates. Error bars are SD. Asterisks indicate significant differences (*P < 0.05) between the overexpression line and the Col-0 wild type. Dashed line: averaged lower threshold in the set of experiments for the respective target (Ct = 35) relative to the respective UBQ10 levels. Dotted line: average lower threshold + SD. The solid line equals 1. The y-axis is in log10-scaled. See Table S5 for more details on the underlying data and statistics.

