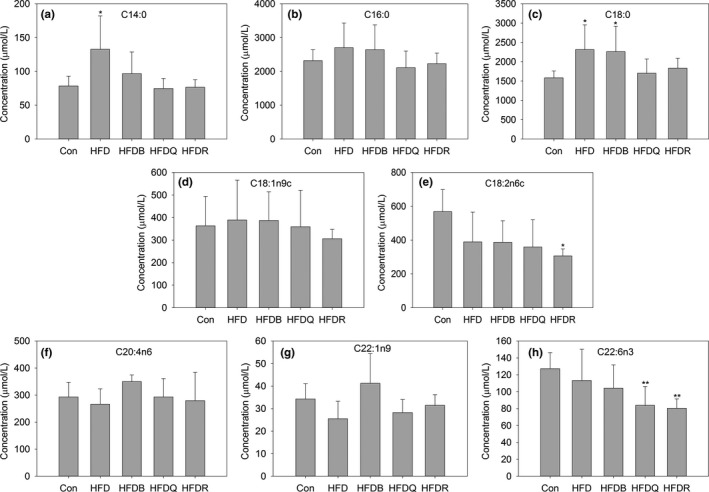
Figure 3.

Effect of Tartary buckwheat and flavonoids on serum fatty acid. ** p < .01 and * p < .05 denote statistically significant differences with control group; ## p < .01 and # p < .05 denote statistically significant differences with HFD group

Effect of Tartary buckwheat and flavonoids on serum fatty acid. ** p < .01 and * p < .05 denote statistically significant differences with control group; ## p < .01 and # p < .05 denote statistically significant differences with HFD group