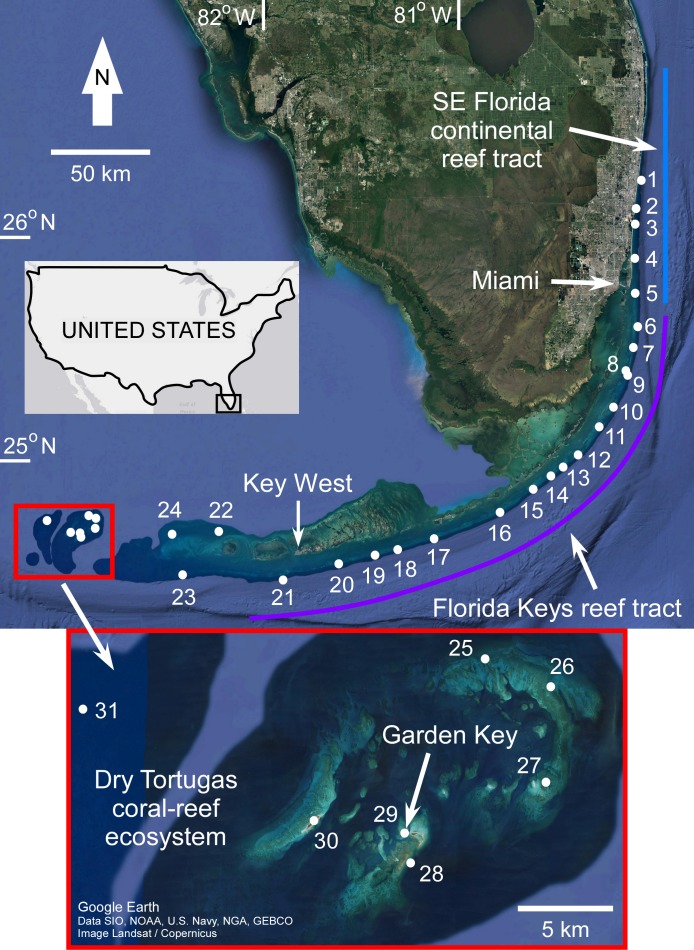
Figure 1. Map of coral sample locations from south Florida.
The locations of coral samples comprising the sea-level database are depicted by numbered white circles (see Stathakopoulos & Toth, 2019 for site names). The extent of the three reef subregions are indicated by colored lines. The light blue line indicates the Southeast (SE) Florida continental reef tract, the purple line indicates the Florida Keys reef tract, and the red box (also inset) indicates the Dry Tortugas coral-reef ecosystem. Map from Google Earth, Data SIO, NOAA, U.S. Navy, NGA, GEBCO, Image Landsat/Copernicus.

