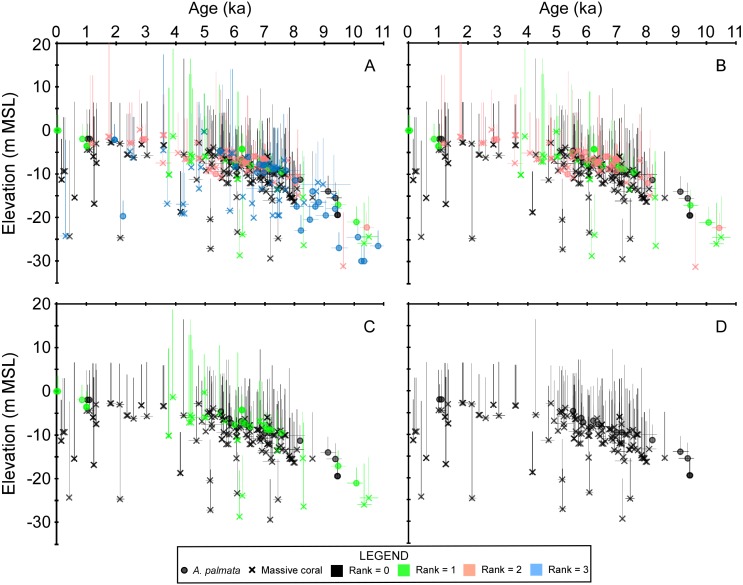
Figure 3. Plots of the coral age-elevation data iteratively removing samples based on the taphonomic screening criteria.
Rankings range from the most stringent taphonomic criteria (rank = 0) to the most uncertain (rank = 3). Elevation is referenced to present mean sea level (MSL). Negative vertical error bars are the root sum square of the elevation uncertainties (2σ) and positive vertical error bars are the root sum square of the elevation uncertainties and the coral taxa depth distributions at 95% confidence intervals (2σ). Horizontal error bars (2σ uncertainty) are only depicted for samples that have age-error ranges ≥250 years. See Methods for explanations of error bars and screening procedures. (A) All coral data. (B) Coral data ranked from 0–2. (C) Coral data ranked from 0–1. (D) Coral data with a rank = 0 which were considered as in situ samples herein.

