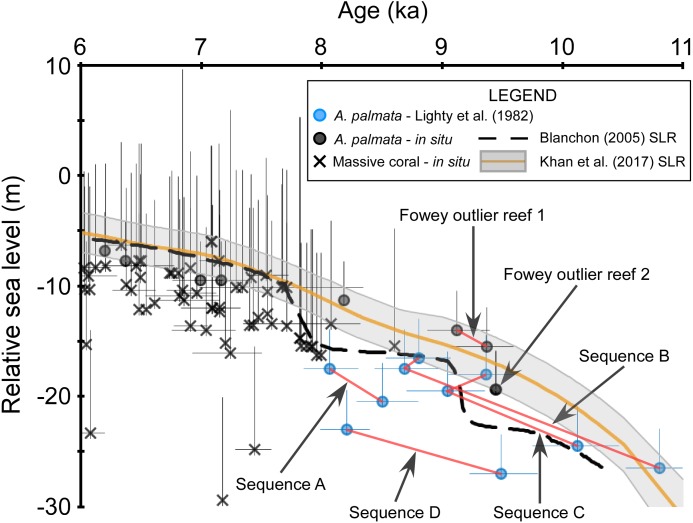
Figure 5. Discrepancies within the early Holocene sea level dataset.
Coral data that passed our screening criteria are depicted as black symbols and are plotted with the data of Lighty, Macintyre & Stuckenrath (1982), blue symbols, which did not pass our screening because the associated samples were unavailable for visual analysis. Red lines connect samples that are from the same sampled outcrop (Sequences A–D from Lighty, Macintyre & Stuckenrath, 1982) or drill-core (Fowey outlier reef 1 from Lidz, Reich & Shinn, 2003). Negative vertical error bars are the root sum square of the elevation uncertainties (2σ) and positive vertical error bars are the root sum square of the elevation uncertainties and the coral taxa depth distributions at 95% confidence intervals (2σ). Horizontal error bars (2σ uncertainty) are only depicted for samples that have age-error ranges ≥250 years. See Methods for explanations of error bars and screening procedures. Relative sea level is referenced to present mean sea level. The Blanchon (2005) sea-level reconstruction (SLR) is a reinterpretation of the Toscano & Macintyre (2003) SLR.

